10 KiB
+++ title="Does Aerogramme use lot of RAM?" date=2024-02-15 +++
"Will Aerogramme use lot of RAM" was the first question we asked ourselves when designing email mailboxes as an encrypted event log. This blog post tries to evaluate our design assumptions to the real world implementation, similarly to what we have done on Garage.
Methodology
Brendan Gregg, a very respected figure in the world of system performances, says that, for many reasons, ~100% of benchmarks are wrong. This benchmark will be wrong too in multiple ways:
- It will not say anything about Aerogramme performances in real world deployments
- It will not say anything about Aerogramme performances compared to other email servers
However, I pursue a very specific goal with this benchmark: validating if the assumptions we have done during the design phase, in term of compute and memory complexity, holds for real.
I will observe only two metrics: the CPU time used by the program (everything except idle and iowait based on the psutil code) - for the computing complexity - and the Resident Set Size (data held RAM) - for the memory complexity.
Testing environment
I ran all the tests on my personal computer, a Dell Inspiron 7775 with an AMD Ryzen 7 1700, 16GB of RAM, an encrypted SSD, on NixOS 23.11. The setup is made of Aerogramme (compiled in release mode) connected to a local, single node, Garage server.
Observations and graphs are done all in once thanks to the psrecord tool. I did not try to make the following values reproducible as it is more an exploration than a definitive review.
Mailbox dataset
I will use a dataset of 100 emails I have made specifically for the occasion. It contains some emails with various attachments, some emails with lots of text, emails generated by many different clients (Thunderbird, Geary, Sogo, Alps, Outlook iOS, GMail iOS, Windows Mail, Postbox, Mailbird, etc.), etc. The mbox file weighs 23MB uncompressed.
One question that arise is: how representative of a real mailbox is this dataset? While a definitive response is not possible, I compared the email sizes of this dataset to the 2 367 emails in my personal inbox. Below I plotted the empirical distribution for both my dataset and my personal inbox (note that the x axis is not linear but logarithimic).

We see that the curves are close together and follow the same pattern: most emails are between 1kB and 100kB, and then we have a long tail (up to 20MB in my inbox, up to 6MB in the dataset). It's not that surprising: on many places on the Internet, the limit on emails is set to 25MB. Overall I am quite satisfied by this simple dataset, even if having one or two bigger emails could make it even more representative of my real inbox...
Mailboxes with only 100 emails are not that common (mine has 2k emails...), so to emulate bigger mailboxes, I simply inject the dataset multiple times (eg. 20 times for 2k emails).
Command dataset
Having a representative mailbox is a thing, but we also need to know what are the typical commands that are sent by IMAP clients. As I have setup a test instance of Aerogramme (see my FOSDEM talk), I was able to extract 4 619 IMAP commands sent by various clients. Many of them are identical, and in the end, only 248 are truly unique. The following bar plot depicts the command distribution per command name; top is the raw count, bottom is the unique count.

First, we can handle separately some commands: LOGIN, CAPABILITY, ENABLE, SELECT, EXAMINE, CLOSE, UNSELECT, LOGOUT as they are part of a connection workflow. We do not plan on studying them directly as they will be used in all other tests.
CHECK, NOOP, IDLE, and STATUS are different approaches to detect a change in the current mailbox (or in other mailboxes in the case of STATUS), I assimilate these commands as a notification mechanism.
FETCH, SEARCH and LIST are query commands, the first two ones for emails, the last one for mailboxes. FETCH is from far the most used command (1187 occurencies) with the most variations (128 unique combination of parameters). SEARCH is also used a lot (658 occurencies, 14 unique).
APPEND, STORE, EXPUNGE, MOVE, COPY, LSUB, SUBSCRIBE, CREATE, DELETE are commands to write things: flags, emails or mailboxes. They are not used a lot but some writes are hidden in other commands (CLOSE, FETCH), and when mails arrive, they are delivered through a different protocol (LMTP) that does not appear here. In the following, we will assess that APPEND behaves more or less than a LMTP delivery.
In the following, I will keep these 3 categories: writing, notification, and query to evaluate Aerogramme's ressource usage based on command patterns observed on real IMAP commands.
Write Commands
I inserted the full dataset (100 emails) to 16 accounts (the server now handles 1 600 emails then). See the script
APPEND
First, I observed this scary linear memory increase. It seems we are not releasing some memory, and that's an issue! I quickly suspected tokio-console of being the culprit. A quick search lead me to an issue entitled Continuous memory leak with console_subscriber #184 that confirmed my intuition. Instead of waiting for an hour or trying to tweak the retention time, I tried a build without tokio console.
So in a first approach, we observed the impact of tokio console instead of our code! Still, we want to have performances as predictable as possible.

Which got us to this second pattern: a stable but high memory usage compared to previous run.
It appears I built the binary with cargo release, which creates a binary that dynamically link to the GNU libc.
While the previous binary was made with our custom Nix toolchain that statically compiles the Musl libc.
In the process, we changed the allocator: it seems the GNU libc allocator allocates bigger chunks at once.
It would be wrong to conclude the musl libc allocator is more efficient: allocating and unallocating memory on the kernel side is costly, and thus it might be better for the allocator to keep some kernel allocated memory for future memory allocations that will not require system calls. This is another example of why this benchmark is wrong: we observe the memory allocated by the allocator, not the memory used by program itself.
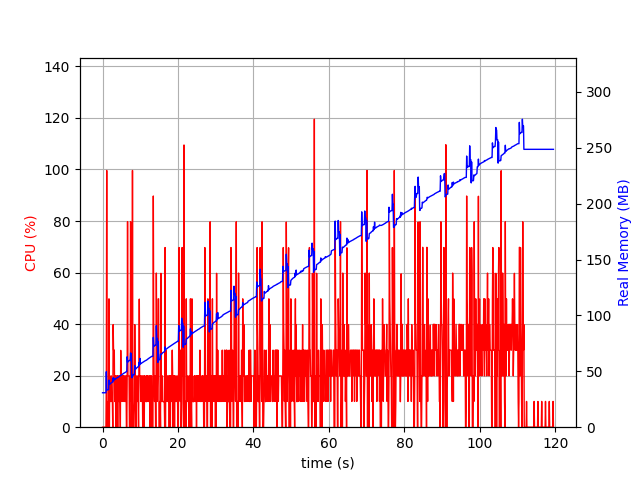
For the next graph, I removed tokio-console but built Aerogramme with static musl libc.

We observe 16 spikes of memory allocation, around 50MB, followed by a 25MB memory usage. In the end, we drop to ~18MB. We do not try to analyze the spike for now. However, we can assume the 25MB memory usage accounts for the base memory consumption plus the index of the user's mailbox. Once the last user logged out, memory drops to 18MB. In this scenario, a user accounts for around 7MB.
We will see later that some other use cases lead to a lower per-user RAM consumption. An hypothesis: we are doing some requests on S3 with the aws-sdk library that is intended to be configured once per process, and handles internally the threading logic. In our case, we instantiate it once per user, tweaking its configuration might help. Again, we are not observing - only - our code!
In the previous runs, we were doing the inserts sequentially. But in the real world, multiple users interact with the server at the same time. In the next run, we run the same test but in parrallel.
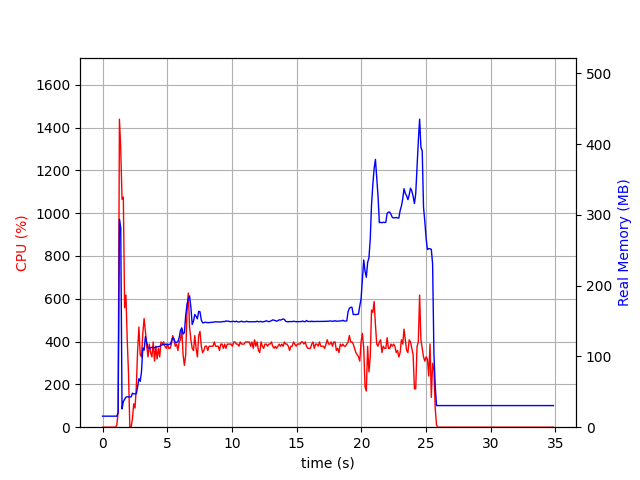
We see 2 spikes: a short one at the beggining, and a longer one at the end.
Notification Commands
NOOP & CHECK
TODO
STATUS
TODO
IDLE

Query Commands
FETCH 1:* ALL
FETCH 1:* FULL

Which crashed the Garage server:
ERROR hyper::server::tcp: accept error: No file descriptors available (os error 24)
SEARCH
TODO
LIST
TODO
Conclusion
TBD