Unbounded block buffering, was: nomad (lmdb / sqlite): inevitable OOM #788

Closed
opened 2024-03-26 09:03:22 +00:00 by Cycneuramus · 20 comments

Hello there! I'm using Nomad on Debian 12 to run a three-node garage cluster (v0.9.3), and rclone to interact with the S3 API. Setup was generally a breeze and everything seems to run smoothly.

When I go on to perform my first bulk upload, however, garage will start gobbling up memory until the process is inevitably OOM killed by the Nomad scheduler. There are no errors in the logs.

Yes, I am running Nomad with memory oversubscription enabled, but it doesn't seem to matter how much memory I assign in the memory_max parameter: usage will climb and climb until the OOM hammer falls. I stopped trying at 4096 MB.

Now, my initial attempts were with the LMDB engine, about which, as my troubleshooting began, I found some similar reports (e.g. #439, #509, #517, #681). So I went on to rebuild the cluster with the SQLite backend instead. The results, however, were the same: I'd start an upload process and watch the memory usage climb until garage is OOM killed.

The upload process in question looks like this:

rclone copy large-dir garage:cld/large-dir --progress --transfers 16 --fast-list

Here large-dir is 38 GB worth of files in the 5–10 MB range. I tried experimenting with the --transfers flag (smaller values, omitting it entirely), no --fast-list, etc. but nothing of this seems to make a difference.

The rclone backend is defined as follows:

[garage]
type = s3
provider = Other
env_auth = false
access_key_id = <redacted>
secret_access_key = <redacted>
region = garage
endpoint = <redacted>
force_path_style = true
acl = private
bucket_acl = private

This is the Nomad job definition:

locals {
  strg    = pathexpand("~/.local/share/s3")
  version = "0.9.3"
}

job "garage" {
  constraint {
    attribute = "${meta.garage}"
    value     = "true"
  }

  constraint {
    distinct_hosts = true
  }

  group "garage" {
    count = 3

    network {
      port "s3" {
        to           = 3900
        static       = 3900
        host_network = "private"
      }

      port "rpc" {
        to           = 3901
        static       = 3901
        host_network = "private"
      }

      port "web" {
        to           = 3902
        host_network = "private"
      }

      port "admin" {
        to           = 3903
        static       = 3903
        host_network = "private"
      }
    }

    task "garage" {
      driver = "docker"
      user   = "1000:1000"

      kill_signal  = "SIGINT"
      kill_timeout = "30s"

      resources {
        memory_max = 2048
      }

      service {
        name     = "garage-${attr.unique.hostname}"
        port     = "web"
        provider = "nomad"
        tags     = ["local"]
      }

      service {
        name     = "garage-s3"
        port     = "s3"
        provider = "nomad"
        tags     = ["local", "multi"]
      }

      template {
        data        = file("garage.toml.tpl")
        destination = "local/garage.toml"
      }

      env {
        GARAGE_CONFIG_FILE = "/local/garage.toml"
      }

      config {
        image = "dxflrs/garage:v${local.version}"
        ports = ["admin", "rpc", "s3", "web"]

        mount {
          type   = "bind"
          source = "${local.strg}/meta"
          target = "/var/lib/garage/meta"
        }

        mount {
          type   = "bind"
          source = "${local.strg}/data"
          target = "/var/lib/garage/data"
        }
      }
    }
  }
}

And the garage.toml.tpl (which is verified to render correct values in the Nomad job):

metadata_dir = "/var/lib/garage/meta"
data_dir = "/var/lib/garage/data"
db_engine = "sqlite"

# db_engine = "lmdb"
# lmdb_map_size = "1GiB"

replication_mode = "3"

compression_level = 1

rpc_secret = "<redacted>"
rpc_bind_addr = "[::]:{{ env "NOMAD_PORT_rpc" }}"
rpc_public_addr = "{{ env "NOMAD_IP_rpc" }}:{{ env "NOMAD_PORT_rpc" }}"

[s3_api]
s3_region = "garage"
api_bind_addr = "[::]:{{ env "NOMAD_PORT_s3" }}"
root_domain = ".s3.garage"

[s3_web]
bind_addr = "[::]:{{ env "NOMAD_PORT_web" }}"
root_domain = ".web.garage"

[admin]
api_bind_addr = "0.0.0.0:3903"
metrics_token = "<redacted>"
admin_token = "<redacted>"
Hello there! I'm using Nomad on Debian 12 to run a three-node garage cluster (v0.9.3), and `rclone` to interact with the S3 API. Setup was generally a breeze and everything seems to run smoothly. When I go on to perform my first bulk upload, however, garage will start gobbling up memory until the process is inevitably OOM killed by the Nomad scheduler. There are no errors in the logs. Yes, I am running Nomad with [memory oversubscription](https://developer.hashicorp.com/nomad/docs/job-specification/resources#memory-oversubscription) enabled, but it doesn't seem to matter how much memory I assign in the [`memory_max`](https://developer.hashicorp.com/nomad/docs/job-specification/resources#memory_max) parameter: usage will climb and climb until the OOM hammer falls. I stopped trying at 4096 MB. Now, my initial attempts were with the LMDB engine, about which, as my troubleshooting began, I found some similar reports (e.g. [#439](https://git.deuxfleurs.fr/Deuxfleurs/garage/issues/439), [#509](https://git.deuxfleurs.fr/Deuxfleurs/garage/issues/509), [#517](https://git.deuxfleurs.fr/Deuxfleurs/garage/issues/517), [#681](https://git.deuxfleurs.fr/Deuxfleurs/garage/issues/681)). So I went on to rebuild the cluster with the SQLite backend instead. The results, however, were the same: I'd start an upload process and watch the memory usage climb until garage is OOM killed. The upload process in question looks like this: `rclone copy large-dir garage:cld/large-dir --progress --transfers 16 --fast-list` Here `large-dir` is 38 GB worth of files in the 5–10 MB range. I tried experimenting with the `--transfers` flag (smaller values, omitting it entirely), no `--fast-list`, etc. but nothing of this seems to make a difference. The `rclone` backend is defined as follows: ``` [garage] type = s3 provider = Other env_auth = false access_key_id = <redacted> secret_access_key = <redacted> region = garage endpoint = <redacted> force_path_style = true acl = private bucket_acl = private ``` This is the Nomad job definition: ``` locals { strg = pathexpand("~/.local/share/s3") version = "0.9.3" } job "garage" { constraint { attribute = "${meta.garage}" value = "true" } constraint { distinct_hosts = true } group "garage" { count = 3 network { port "s3" { to = 3900 static = 3900 host_network = "private" } port "rpc" { to = 3901 static = 3901 host_network = "private" } port "web" { to = 3902 host_network = "private" } port "admin" { to = 3903 static = 3903 host_network = "private" } } task "garage" { driver = "docker" user = "1000:1000" kill_signal = "SIGINT" kill_timeout = "30s" resources { memory_max = 2048 } service { name = "garage-${attr.unique.hostname}" port = "web" provider = "nomad" tags = ["local"] } service { name = "garage-s3" port = "s3" provider = "nomad" tags = ["local", "multi"] } template { data = file("garage.toml.tpl") destination = "local/garage.toml" } env { GARAGE_CONFIG_FILE = "/local/garage.toml" } config { image = "dxflrs/garage:v${local.version}" ports = ["admin", "rpc", "s3", "web"] mount { type = "bind" source = "${local.strg}/meta" target = "/var/lib/garage/meta" } mount { type = "bind" source = "${local.strg}/data" target = "/var/lib/garage/data" } } } } } ``` And the `garage.toml.tpl` (which is verified to render correct values in the Nomad job): ``` metadata_dir = "/var/lib/garage/meta" data_dir = "/var/lib/garage/data" db_engine = "sqlite" # db_engine = "lmdb" # lmdb_map_size = "1GiB" replication_mode = "3" compression_level = 1 rpc_secret = "<redacted>" rpc_bind_addr = "[::]:{{ env "NOMAD_PORT_rpc" }}" rpc_public_addr = "{{ env "NOMAD_IP_rpc" }}:{{ env "NOMAD_PORT_rpc" }}" [s3_api] s3_region = "garage" api_bind_addr = "[::]:{{ env "NOMAD_PORT_s3" }}" root_domain = ".s3.garage" [s3_web] bind_addr = "[::]:{{ env "NOMAD_PORT_web" }}" root_domain = ".web.garage" [admin] api_bind_addr = "0.0.0.0:3903" metrics_token = "<redacted>" admin_token = "<redacted>" ```
Author

Output of garage status:

==== HEALTHY NODES ====
ID                Hostname      Address           Tags    Zone  Capacity  DataAvail
a651293fdf8c34ca  1165a2dc65a8  10.10.10.13:3901  [arm]   ocl   150.0 GB  150.5 GB (93.5%)
dd71c0536684b39f  2ba8115cf5a5  10.10.10.12:3901  [arca]  exo   450.0 GB  499.9 GB (79.2%)
440aafcf40c225fe  2d6b5a9293a3  10.10.10.10:3901  [apex]  eso   250.0 GB  283.9 GB (58.0%)

And of garage layout show:

==== CURRENT CLUSTER LAYOUT ====
ID                Tags  Zone  Capacity  Usable capacity
440aafcf40c225fe  apex  eso   250.0 GB  150.0 GB (60.0%)
a651293fdf8c34ca  arm   ocl   150.0 GB  150.0 GB (100.0%)
dd71c0536684b39f  arca  exo   450.0 GB  150.0 GB (33.3%)

Zone redundancy: maximum

Current cluster layout version: 1
Output of `garage status`: ``` ==== HEALTHY NODES ==== ID Hostname Address Tags Zone Capacity DataAvail a651293fdf8c34ca 1165a2dc65a8 10.10.10.13:3901 [arm] ocl 150.0 GB 150.5 GB (93.5%) dd71c0536684b39f 2ba8115cf5a5 10.10.10.12:3901 [arca] exo 450.0 GB 499.9 GB (79.2%) 440aafcf40c225fe 2d6b5a9293a3 10.10.10.10:3901 [apex] eso 250.0 GB 283.9 GB (58.0%) ``` And of `garage layout show`: ``` ==== CURRENT CLUSTER LAYOUT ==== ID Tags Zone Capacity Usable capacity 440aafcf40c225fe apex eso 250.0 GB 150.0 GB (60.0%) a651293fdf8c34ca arm ocl 150.0 GB 150.0 GB (100.0%) dd71c0536684b39f arca exo 450.0 GB 150.0 GB (33.3%) Zone redundancy: maximum Current cluster layout version: 1 ```
Owner

Hello, thanks for the bug report.

Generally Garage uses a reasonable amount of RAM, it does not grow infinitely when requests are submitted. The behavior you are seeing is anormal and unexpected. Unfortunately, I don't know where this can come from and I don't see anything wrong in your setup.

The next steps to debug this are:

  • check for anything wierd in the logs

  • use a development build with profiling tools / instrumentation to try to figure out what is going on

Hello, thanks for the bug report. Generally Garage uses a reasonable amount of RAM, it does not grow infinitely when requests are submitted. The behavior you are seeing is anormal and unexpected. Unfortunately, I don't know where this can come from and I don't see anything wrong in your setup. The next steps to debug this are: - check for anything wierd in the logs - use a development build with profiling tools / instrumentation to try to figure out what is going on
Author

Very strange indeed. The Nomad cluster in which I'm deploying Garage has been chugging along fine for a long time, running some 50+ allocations without issue. Given the resource isolation of Nomad jobs, I can't think of anything that would affect the environment running Garage other than what you see here.

Nothing weird in the logs, and no block errors or anything of the kind.

Before diving into development builds, I'll try to find some time to redeploy on bare-metal to exclude the possibility that it's related to the resource allocations and so forth inherent to Nomad and Docker.

Very strange indeed. The Nomad cluster in which I'm deploying Garage has been chugging along fine for a long time, running some 50+ allocations without issue. Given the resource isolation of Nomad jobs, I can't think of anything that would affect the environment running Garage other than what you see here. Nothing weird in the logs, and no block errors or anything of the kind. Before diving into development builds, I'll try to find some time to redeploy on bare-metal to exclude the possibility that it's related to the resource allocations and so forth inherent to Nomad and Docker.
Author

I redeployed on bare metal with an identical configuration and made some interesting findings. The excessive memory usage does in fact occur, same as in the Nomad environment, but it seems this is specific to upload jobs handling certain types of files. Let me illustrate what I mean.

One the one hand, here is the memory usage of the Garage process during 4 minutes of uploading a directory containing ~40 000 small files (mostly webp and jpeg thumbnails):

rclone copy thumb-dir garage:cld/thumb-dir --progress --fast-list --transfers 8

$ while true; do ps -o rss= -p 2921977 | awk '{print $1/1024}'; sleep 30; done
25.1641
53.4375
25.5977
24.1758
24.0938
24.3203
27.0859
24.5703

The values represent memory usage in MB, captured every 30 seconds. As you can see, no problems here.

On the other hand, here is the memory usage during 4 minutes of uploading my initial test directory of ~5000 files in the 5–10 MB range (mostly mp3 files):

rclone copy mp3-dir garage:cld/mp3-dir --progress --fast-list --transfers 8

$ while true; do ps -o rss= -p 2921977 | awk '{print $1/1024}'; sleep 30; done
22.75
393.691
669.582
997.43
1389.43
1761.39
2184.75
2611.92

And on it goes until I stop the upload. I don't quite know what to make of this since, as you said, this is unexpected behaviour, but I figured I might as well include my findings here.

I redeployed on bare metal with an identical configuration and made some interesting findings. The excessive memory usage does in fact occur, same as in the Nomad environment, but it seems this is specific to upload jobs handling certain types of files. Let me illustrate what I mean. One the one hand, here is the memory usage of the Garage process during 4 minutes of uploading a directory containing ~40 000 small files (mostly `webp` and `jpeg` thumbnails): `rclone copy thumb-dir garage:cld/thumb-dir --progress --fast-list --transfers 8` ``` $ while true; do ps -o rss= -p 2921977 | awk '{print $1/1024}'; sleep 30; done 25.1641 53.4375 25.5977 24.1758 24.0938 24.3203 27.0859 24.5703 ``` The values represent memory usage in MB, captured every 30 seconds. As you can see, no problems here. On the other hand, here is the memory usage during 4 minutes of uploading my initial test directory of ~5000 files in the 5–10 MB range (mostly `mp3` files): `rclone copy mp3-dir garage:cld/mp3-dir --progress --fast-list --transfers 8` ``` $ while true; do ps -o rss= -p 2921977 | awk '{print $1/1024}'; sleep 30; done 22.75 393.691 669.582 997.43 1389.43 1761.39 2184.75 2611.92 ``` And on it goes until I stop the upload. I don't quite know what to make of this since, as you said, this is unexpected behaviour, but I figured I might as well include my findings here.
Owner

Ok, so I think I know what is going on, and this is indeed a bug in Garage. I suppose one of your nodes has a slower internet connection, and you are expecting it to receive copies of your objects asynchronously? Currently, the node that is receiving your put object requests is able to store the data fast locally and on one of the other nodes, but since it wants to make three copies in total it also keeps the data blocks buffered in RAM to send them to the third node. Unfortunately, the third node cannot receive data as fast and so this buffered data grows unboundedly. I don't know if rclone has an option to limit the upload speed but if it does you could try that, by limiting the speed to the speed of your slowest internet link.

I think we want to solve this issue in Garage, and basically there would be two strategies to do so:

  • allow to buffer a certain number of pending writes, but when a limit of RAM consumption is attained, reduce the speed at which we receive data from the client to apply backpressure

  • store all blocks as fast as possible on the local node and the one with a fast internet connection, and don't keep outstanding requests to the third node, just use an on-disk queue to transfer the data fully asynchronously

Which option would be the closest to what you would expect of Garage?

I think the downside of the second option is that the third nodes risks to never be able to catch up if too much data is coming into the cluster continuously.

Ok, so I think I know what is going on, and this is indeed a bug in Garage. I suppose one of your nodes has a slower internet connection, and you are expecting it to receive copies of your objects asynchronously? Currently, the node that is receiving your put object requests is able to store the data fast locally and on one of the other nodes, but since it wants to make three copies in total it also keeps the data blocks buffered in RAM to send them to the third node. Unfortunately, the third node cannot receive data as fast and so this buffered data grows unboundedly. I don't know if rclone has an option to limit the upload speed but if it does you could try that, by limiting the speed to the speed of your slowest internet link. I think we want to solve this issue in Garage, and basically there would be two strategies to do so: - allow to buffer a certain number of pending writes, but when a limit of RAM consumption is attained, reduce the speed at which we receive data from the client to apply backpressure - store all blocks as fast as possible on the local node and the one with a fast internet connection, and don't keep outstanding requests to the third node, just use an on-disk queue to transfer the data fully asynchronously Which option would be the closest to what you would expect of Garage? I think the downside of the second option is that the third nodes risks to never be able to catch up if too much data is coming into the cluster continuously.
lx changed title from nomad (lmdb / sqlite): inevitable OOM to Unbounded block buffering, was: nomad (lmdb / sqlite): inevitable OOM 2024-03-27 10:38:12 +00:00
lx added the
Bug
label 2024-03-27 10:38:20 +00:00
Author

I'm glad we're approaching a diagnosis. Of the two strategies you mention, I would agree that the first one sounds safer.

I suppose one of your nodes has a slower internet connection, and you are expecting it to receive copies of your objects asynchronously

I'm not quite sure what you mean by this. My understanding of replication_mode = "3" (which is what my cluster is configured with) was that write operations need to complete on all three nodes before continuing, but perhaps I got that wrong. The only reference to asynchronous writes that I can find in the documentation refers to replication_mode = "2-dangerous".

In any case, I made an initial quick test with the rclone flag --bwlimit set to 10M:10M (limiting up/down bandwidth to 10 MiB/s), but this seems to have made no difference, despite my slowest internet link being 200 Mbit/s which should be well more than enough. I stopped the upload at 1,250 MB RAM usage and noticed that, several minutes later, Garage would still sit at that level of memory usage—on all three nodes, not just the one receiving PUT requests.

I then tested with --bwlimit set to 1M:1M, and now, finally, memory usage seems to be in check. Those are hardly usable speeds, though.

Just for the sake of completeness, I thought I should mention that latency between the three nodes are never more than 30ms, and I'll also include here some iperf3 measurements between the node that is receiving PUT object requests and the other two nodes:

$ iperf3 -c 10.10.10.12 -P 5
Connecting to host 10.10.10.12, port 5201
[  5] local 10.10.10.10 port 35524 connected to 10.10.10.12 port 5201
[  7] local 10.10.10.10 port 35532 connected to 10.10.10.12 port 5201
[  9] local 10.10.10.10 port 35534 connected to 10.10.10.12 port 5201
[ 11] local 10.10.10.10 port 35542 connected to 10.10.10.12 port 5201
[ 13] local 10.10.10.10 port 35546 connected to 10.10.10.12 port 5201
[ ID] Interval           Transfer     Bitrate         Retr  Cwnd
[  5]   0.00-1.00   sec  4.26 MBytes  35.7 Mbits/sec    8    254 KBytes
[  7]   0.00-1.00   sec  5.01 MBytes  42.0 Mbits/sec   14    287 KBytes
[  9]   0.00-1.00   sec  5.62 MBytes  47.1 Mbits/sec    7    319 KBytes
[ 11]   0.00-1.00   sec  5.42 MBytes  45.5 Mbits/sec   21    327 KBytes
[ 13]   0.00-1.00   sec  5.61 MBytes  47.1 Mbits/sec   25    313 KBytes
[SUM]   0.00-1.00   sec  25.9 MBytes   217 Mbits/sec   75
- - - - - - - - - - - - - - - - - - - - - - - - -
[  5]   1.00-2.00   sec  4.23 MBytes  35.5 Mbits/sec    0    294 KBytes
[  7]   1.00-2.00   sec  4.29 MBytes  36.0 Mbits/sec    0    331 KBytes
[  9]   1.00-2.00   sec  4.91 MBytes  41.1 Mbits/sec    0    367 KBytes
[ 11]   1.00-2.00   sec  5.40 MBytes  45.3 Mbits/sec    0    377 KBytes
[ 13]   1.00-2.00   sec  4.41 MBytes  37.0 Mbits/sec    0    359 KBytes
[SUM]   1.00-2.00   sec  23.2 MBytes   195 Mbits/sec    0
- - - - - - - - - - - - - - - - - - - - - - - - -
[  5]   2.00-3.00   sec  3.80 MBytes  31.9 Mbits/sec    0    319 KBytes
[  7]   2.00-3.00   sec  4.29 MBytes  36.0 Mbits/sec    0    361 KBytes
[  9]   2.00-3.00   sec  4.41 MBytes  37.0 Mbits/sec    0    401 KBytes
[ 11]   2.00-3.00   sec  4.91 MBytes  41.1 Mbits/sec    0    410 KBytes
[ 13]   2.00-3.00   sec  4.91 MBytes  41.1 Mbits/sec    0    391 KBytes
[SUM]   2.00-3.00   sec  22.3 MBytes   187 Mbits/sec    0
- - - - - - - - - - - - - - - - - - - - - - - - -
[  5]   3.00-4.00   sec  3.68 MBytes  30.9 Mbits/sec    3    239 KBytes
[  7]   3.00-4.00   sec  4.29 MBytes  36.0 Mbits/sec    2    270 KBytes
[  9]   3.00-4.00   sec  5.40 MBytes  45.3 Mbits/sec    0    419 KBytes
[ 11]   3.00-4.00   sec  4.97 MBytes  41.7 Mbits/sec    0    432 KBytes
[ 13]   3.00-4.00   sec  4.91 MBytes  41.2 Mbits/sec    0    410 KBytes
[SUM]   3.00-4.00   sec  23.2 MBytes   195 Mbits/sec    5
- - - - - - - - - - - - - - - - - - - - - - - - -
[  5]   4.00-5.00   sec  3.00 MBytes  25.2 Mbits/sec    0    261 KBytes
[  7]   4.00-5.00   sec  3.50 MBytes  29.3 Mbits/sec    0    295 KBytes
[  9]   4.00-5.00   sec  5.40 MBytes  45.3 Mbits/sec    0    430 KBytes
[ 11]   4.00-5.00   sec  5.46 MBytes  45.8 Mbits/sec    0    442 KBytes
[ 13]   4.00-5.00   sec  4.91 MBytes  41.1 Mbits/sec    0    421 KBytes
[SUM]   4.00-5.00   sec  22.3 MBytes   187 Mbits/sec    0
^C- - - - - - - - - - - - - - - - - - - - - - - - -
[  5]   5.00-5.57   sec  1.72 MBytes  25.1 Mbits/sec    0    270 KBytes
[  7]   5.00-5.57   sec  2.21 MBytes  32.3 Mbits/sec    0    305 KBytes
[  9]   5.00-5.57   sec  2.94 MBytes  43.1 Mbits/sec    0    433 KBytes
[ 11]   5.00-5.57   sec  2.94 MBytes  43.1 Mbits/sec    0    445 KBytes
[ 13]   5.00-5.57   sec  2.94 MBytes  43.1 Mbits/sec    0    423 KBytes
[SUM]   5.00-5.57   sec  12.8 MBytes   187 Mbits/sec    0
- - - - - - - - - - - - - - - - - - - - - - - - -
[ ID] Interval           Transfer     Bitrate         Retr
[  5]   0.00-5.57   sec  20.7 MBytes  31.1 Mbits/sec   11             sender
[  5]   0.00-5.57   sec  0.00 Bytes  0.00 bits/sec                  receiver
[  7]   0.00-5.57   sec  23.6 MBytes  35.5 Mbits/sec   16             sender
[  7]   0.00-5.57   sec  0.00 Bytes  0.00 bits/sec                  receiver
[  9]   0.00-5.57   sec  28.7 MBytes  43.2 Mbits/sec    7             sender
[  9]   0.00-5.57   sec  0.00 Bytes  0.00 bits/sec                  receiver
[ 11]   0.00-5.57   sec  29.1 MBytes  43.8 Mbits/sec   21             sender
[ 11]   0.00-5.57   sec  0.00 Bytes  0.00 bits/sec                  receiver
[ 13]   0.00-5.57   sec  27.7 MBytes  41.7 Mbits/sec   25             sender
[ 13]   0.00-5.57   sec  0.00 Bytes  0.00 bits/sec                  receiver
[SUM]   0.00-5.57   sec   130 MBytes   195 Mbits/sec   80             sender
[SUM]   0.00-5.57   sec  0.00 Bytes  0.00 bits/sec                  receiver
$ iperf3 -c 10.10.10.13 -P 5
Connecting to host 10.10.10.13, port 5201
[  5] local 10.10.10.10 port 57628 connected to 10.10.10.13 port 5201
[  7] local 10.10.10.10 port 57640 connected to 10.10.10.13 port 5201
[  9] local 10.10.10.10 port 57652 connected to 10.10.10.13 port 5201
[ 11] local 10.10.10.10 port 57664 connected to 10.10.10.13 port 5201
[ 13] local 10.10.10.10 port 57674 connected to 10.10.10.13 port 5201
[ ID] Interval           Transfer     Bitrate         Retr  Cwnd
[  5]   0.00-1.00   sec  13.2 MBytes   111 Mbits/sec  233    191 KBytes
[  7]   0.00-1.00   sec  14.2 MBytes   120 Mbits/sec  250    239 KBytes
[  9]   0.00-1.00   sec  13.9 MBytes   116 Mbits/sec  291    226 KBytes
[ 11]   0.00-1.00   sec  14.5 MBytes   122 Mbits/sec  322    231 KBytes
[ 13]   0.00-1.00   sec  13.8 MBytes   115 Mbits/sec  176    214 KBytes
[SUM]   0.00-1.00   sec  69.6 MBytes   584 Mbits/sec  1272
- - - - - - - - - - - - - - - - - - - - - - - - -
[  5]   1.00-2.00   sec  10.0 MBytes  83.9 Mbits/sec    0    227 KBytes
[  7]   1.00-2.00   sec  10.0 MBytes  83.9 Mbits/sec    1    198 KBytes
[  9]   1.00-2.00   sec  12.5 MBytes   105 Mbits/sec    0    261 KBytes
[ 11]   1.00-2.00   sec  11.2 MBytes  94.4 Mbits/sec    2    191 KBytes
[ 13]   1.00-2.00   sec  11.2 MBytes  94.4 Mbits/sec    0    250 KBytes
[SUM]   1.00-2.00   sec  55.0 MBytes   461 Mbits/sec    3
- - - - - - - - - - - - - - - - - - - - - - - - -
[  5]   2.00-3.00   sec  12.5 MBytes   105 Mbits/sec    0    265 KBytes
[  7]   2.00-3.00   sec  10.0 MBytes  83.9 Mbits/sec    2    168 KBytes
[  9]   2.00-3.00   sec  15.0 MBytes   126 Mbits/sec    0    298 KBytes
[ 11]   2.00-3.00   sec  10.0 MBytes  83.9 Mbits/sec    2    162 KBytes
[ 13]   2.00-3.00   sec  10.0 MBytes  83.9 Mbits/sec    3    210 KBytes
[SUM]   2.00-3.00   sec  57.5 MBytes   482 Mbits/sec    7
- - - - - - - - - - - - - - - - - - - - - - - - -
[  5]   3.00-4.00   sec  15.0 MBytes   126 Mbits/sec    0    302 KBytes
[  7]   3.00-4.00   sec  7.50 MBytes  62.9 Mbits/sec    2    148 KBytes
[  9]   3.00-4.00   sec  13.8 MBytes   115 Mbits/sec    5    242 KBytes
[ 11]   3.00-4.00   sec  7.50 MBytes  62.9 Mbits/sec    2    140 KBytes
[ 13]   3.00-4.00   sec  11.2 MBytes  94.4 Mbits/sec    0    244 KBytes
[SUM]   3.00-4.00   sec  55.0 MBytes   461 Mbits/sec    9
- - - - - - - - - - - - - - - - - - - - - - - - -
[  5]   4.00-5.00   sec  16.2 MBytes   136 Mbits/sec    0    338 KBytes
[  7]   4.00-5.00   sec  7.50 MBytes  62.9 Mbits/sec    2    130 KBytes
[  9]   4.00-5.00   sec  12.5 MBytes   105 Mbits/sec    0    278 KBytes
[ 11]   4.00-5.00   sec  7.50 MBytes  62.9 Mbits/sec    0    176 KBytes
[ 13]   4.00-5.00   sec  11.2 MBytes  94.4 Mbits/sec    2    206 KBytes
[SUM]   4.00-5.00   sec  55.0 MBytes   461 Mbits/sec    4
^C- - - - - - - - - - - - - - - - - - - - - - - - -
[  5]   5.00-5.48   sec  7.50 MBytes   132 Mbits/sec    0    355 KBytes
[  7]   5.00-5.48   sec  3.75 MBytes  65.9 Mbits/sec    0    146 KBytes
[  9]   5.00-5.48   sec  6.25 MBytes   110 Mbits/sec    1    208 KBytes
[ 11]   5.00-5.48   sec  5.00 MBytes  87.8 Mbits/sec    0    194 KBytes
[ 13]   5.00-5.48   sec  5.00 MBytes  87.8 Mbits/sec    0    222 KBytes
[SUM]   5.00-5.48   sec  27.5 MBytes   483 Mbits/sec    1
- - - - - - - - - - - - - - - - - - - - - - - - -
[ ID] Interval           Transfer     Bitrate         Retr
[  5]   0.00-5.48   sec  74.5 MBytes   114 Mbits/sec  233             sender
[  5]   0.00-5.48   sec  0.00 Bytes  0.00 bits/sec                  receiver
[  7]   0.00-5.48   sec  53.0 MBytes  81.2 Mbits/sec  257             sender
[  7]   0.00-5.48   sec  0.00 Bytes  0.00 bits/sec                  receiver
[  9]   0.00-5.48   sec  73.9 MBytes   113 Mbits/sec  297             sender
[  9]   0.00-5.48   sec  0.00 Bytes  0.00 bits/sec                  receiver
[ 11]   0.00-5.48   sec  55.8 MBytes  85.4 Mbits/sec  328             sender
[ 11]   0.00-5.48   sec  0.00 Bytes  0.00 bits/sec                  receiver
[ 13]   0.00-5.48   sec  62.5 MBytes  95.7 Mbits/sec  181             sender
[ 13]   0.00-5.48   sec  0.00 Bytes  0.00 bits/sec                  receiver
[SUM]   0.00-5.48   sec   320 MBytes   489 Mbits/sec  1296             sender
[SUM]   0.00-5.48   sec  0.00 Bytes  0.00 bits/sec                  receiver
I'm glad we're approaching a diagnosis. Of the two strategies you mention, I would agree that the first one sounds safer. > I suppose one of your nodes has a slower internet connection, and **you are expecting it to receive copies of your objects asynchronously** I'm not quite sure what you mean by this. My understanding of `replication_mode = "3"` (which is what my cluster is configured with) was that write operations need to complete on all three nodes before continuing, but perhaps I got that wrong. The only reference to asynchronous writes that I can find in the documentation refers to `replication_mode = "2-dangerous"`. In any case, I made an initial quick test with the `rclone` flag `--bwlimit` set to `10M:10M` (limiting up/down bandwidth to 10 MiB/s), but this seems to have made no difference, despite my slowest internet link being 200 Mbit/s which should be well more than enough. I stopped the upload at 1,250 MB RAM usage and noticed that, several minutes later, Garage would still sit at that level of memory usage—on all three nodes, not just the one receiving PUT requests. I then tested with `--bwlimit` set to `1M:1M`, and now, finally, memory usage seems to be in check. Those are hardly usable speeds, though. Just for the sake of completeness, I thought I should mention that latency between the three nodes are never more than 30ms, and I'll also include here some `iperf3` measurements between the node that is receiving PUT object requests and the other two nodes: ``` $ iperf3 -c 10.10.10.12 -P 5 Connecting to host 10.10.10.12, port 5201 [ 5] local 10.10.10.10 port 35524 connected to 10.10.10.12 port 5201 [ 7] local 10.10.10.10 port 35532 connected to 10.10.10.12 port 5201 [ 9] local 10.10.10.10 port 35534 connected to 10.10.10.12 port 5201 [ 11] local 10.10.10.10 port 35542 connected to 10.10.10.12 port 5201 [ 13] local 10.10.10.10 port 35546 connected to 10.10.10.12 port 5201 [ ID] Interval Transfer Bitrate Retr Cwnd [ 5] 0.00-1.00 sec 4.26 MBytes 35.7 Mbits/sec 8 254 KBytes [ 7] 0.00-1.00 sec 5.01 MBytes 42.0 Mbits/sec 14 287 KBytes [ 9] 0.00-1.00 sec 5.62 MBytes 47.1 Mbits/sec 7 319 KBytes [ 11] 0.00-1.00 sec 5.42 MBytes 45.5 Mbits/sec 21 327 KBytes [ 13] 0.00-1.00 sec 5.61 MBytes 47.1 Mbits/sec 25 313 KBytes [SUM] 0.00-1.00 sec 25.9 MBytes 217 Mbits/sec 75 - - - - - - - - - - - - - - - - - - - - - - - - - [ 5] 1.00-2.00 sec 4.23 MBytes 35.5 Mbits/sec 0 294 KBytes [ 7] 1.00-2.00 sec 4.29 MBytes 36.0 Mbits/sec 0 331 KBytes [ 9] 1.00-2.00 sec 4.91 MBytes 41.1 Mbits/sec 0 367 KBytes [ 11] 1.00-2.00 sec 5.40 MBytes 45.3 Mbits/sec 0 377 KBytes [ 13] 1.00-2.00 sec 4.41 MBytes 37.0 Mbits/sec 0 359 KBytes [SUM] 1.00-2.00 sec 23.2 MBytes 195 Mbits/sec 0 - - - - - - - - - - - - - - - - - - - - - - - - - [ 5] 2.00-3.00 sec 3.80 MBytes 31.9 Mbits/sec 0 319 KBytes [ 7] 2.00-3.00 sec 4.29 MBytes 36.0 Mbits/sec 0 361 KBytes [ 9] 2.00-3.00 sec 4.41 MBytes 37.0 Mbits/sec 0 401 KBytes [ 11] 2.00-3.00 sec 4.91 MBytes 41.1 Mbits/sec 0 410 KBytes [ 13] 2.00-3.00 sec 4.91 MBytes 41.1 Mbits/sec 0 391 KBytes [SUM] 2.00-3.00 sec 22.3 MBytes 187 Mbits/sec 0 - - - - - - - - - - - - - - - - - - - - - - - - - [ 5] 3.00-4.00 sec 3.68 MBytes 30.9 Mbits/sec 3 239 KBytes [ 7] 3.00-4.00 sec 4.29 MBytes 36.0 Mbits/sec 2 270 KBytes [ 9] 3.00-4.00 sec 5.40 MBytes 45.3 Mbits/sec 0 419 KBytes [ 11] 3.00-4.00 sec 4.97 MBytes 41.7 Mbits/sec 0 432 KBytes [ 13] 3.00-4.00 sec 4.91 MBytes 41.2 Mbits/sec 0 410 KBytes [SUM] 3.00-4.00 sec 23.2 MBytes 195 Mbits/sec 5 - - - - - - - - - - - - - - - - - - - - - - - - - [ 5] 4.00-5.00 sec 3.00 MBytes 25.2 Mbits/sec 0 261 KBytes [ 7] 4.00-5.00 sec 3.50 MBytes 29.3 Mbits/sec 0 295 KBytes [ 9] 4.00-5.00 sec 5.40 MBytes 45.3 Mbits/sec 0 430 KBytes [ 11] 4.00-5.00 sec 5.46 MBytes 45.8 Mbits/sec 0 442 KBytes [ 13] 4.00-5.00 sec 4.91 MBytes 41.1 Mbits/sec 0 421 KBytes [SUM] 4.00-5.00 sec 22.3 MBytes 187 Mbits/sec 0 ^C- - - - - - - - - - - - - - - - - - - - - - - - - [ 5] 5.00-5.57 sec 1.72 MBytes 25.1 Mbits/sec 0 270 KBytes [ 7] 5.00-5.57 sec 2.21 MBytes 32.3 Mbits/sec 0 305 KBytes [ 9] 5.00-5.57 sec 2.94 MBytes 43.1 Mbits/sec 0 433 KBytes [ 11] 5.00-5.57 sec 2.94 MBytes 43.1 Mbits/sec 0 445 KBytes [ 13] 5.00-5.57 sec 2.94 MBytes 43.1 Mbits/sec 0 423 KBytes [SUM] 5.00-5.57 sec 12.8 MBytes 187 Mbits/sec 0 - - - - - - - - - - - - - - - - - - - - - - - - - [ ID] Interval Transfer Bitrate Retr [ 5] 0.00-5.57 sec 20.7 MBytes 31.1 Mbits/sec 11 sender [ 5] 0.00-5.57 sec 0.00 Bytes 0.00 bits/sec receiver [ 7] 0.00-5.57 sec 23.6 MBytes 35.5 Mbits/sec 16 sender [ 7] 0.00-5.57 sec 0.00 Bytes 0.00 bits/sec receiver [ 9] 0.00-5.57 sec 28.7 MBytes 43.2 Mbits/sec 7 sender [ 9] 0.00-5.57 sec 0.00 Bytes 0.00 bits/sec receiver [ 11] 0.00-5.57 sec 29.1 MBytes 43.8 Mbits/sec 21 sender [ 11] 0.00-5.57 sec 0.00 Bytes 0.00 bits/sec receiver [ 13] 0.00-5.57 sec 27.7 MBytes 41.7 Mbits/sec 25 sender [ 13] 0.00-5.57 sec 0.00 Bytes 0.00 bits/sec receiver [SUM] 0.00-5.57 sec 130 MBytes 195 Mbits/sec 80 sender [SUM] 0.00-5.57 sec 0.00 Bytes 0.00 bits/sec receiver ``` ``` $ iperf3 -c 10.10.10.13 -P 5 Connecting to host 10.10.10.13, port 5201 [ 5] local 10.10.10.10 port 57628 connected to 10.10.10.13 port 5201 [ 7] local 10.10.10.10 port 57640 connected to 10.10.10.13 port 5201 [ 9] local 10.10.10.10 port 57652 connected to 10.10.10.13 port 5201 [ 11] local 10.10.10.10 port 57664 connected to 10.10.10.13 port 5201 [ 13] local 10.10.10.10 port 57674 connected to 10.10.10.13 port 5201 [ ID] Interval Transfer Bitrate Retr Cwnd [ 5] 0.00-1.00 sec 13.2 MBytes 111 Mbits/sec 233 191 KBytes [ 7] 0.00-1.00 sec 14.2 MBytes 120 Mbits/sec 250 239 KBytes [ 9] 0.00-1.00 sec 13.9 MBytes 116 Mbits/sec 291 226 KBytes [ 11] 0.00-1.00 sec 14.5 MBytes 122 Mbits/sec 322 231 KBytes [ 13] 0.00-1.00 sec 13.8 MBytes 115 Mbits/sec 176 214 KBytes [SUM] 0.00-1.00 sec 69.6 MBytes 584 Mbits/sec 1272 - - - - - - - - - - - - - - - - - - - - - - - - - [ 5] 1.00-2.00 sec 10.0 MBytes 83.9 Mbits/sec 0 227 KBytes [ 7] 1.00-2.00 sec 10.0 MBytes 83.9 Mbits/sec 1 198 KBytes [ 9] 1.00-2.00 sec 12.5 MBytes 105 Mbits/sec 0 261 KBytes [ 11] 1.00-2.00 sec 11.2 MBytes 94.4 Mbits/sec 2 191 KBytes [ 13] 1.00-2.00 sec 11.2 MBytes 94.4 Mbits/sec 0 250 KBytes [SUM] 1.00-2.00 sec 55.0 MBytes 461 Mbits/sec 3 - - - - - - - - - - - - - - - - - - - - - - - - - [ 5] 2.00-3.00 sec 12.5 MBytes 105 Mbits/sec 0 265 KBytes [ 7] 2.00-3.00 sec 10.0 MBytes 83.9 Mbits/sec 2 168 KBytes [ 9] 2.00-3.00 sec 15.0 MBytes 126 Mbits/sec 0 298 KBytes [ 11] 2.00-3.00 sec 10.0 MBytes 83.9 Mbits/sec 2 162 KBytes [ 13] 2.00-3.00 sec 10.0 MBytes 83.9 Mbits/sec 3 210 KBytes [SUM] 2.00-3.00 sec 57.5 MBytes 482 Mbits/sec 7 - - - - - - - - - - - - - - - - - - - - - - - - - [ 5] 3.00-4.00 sec 15.0 MBytes 126 Mbits/sec 0 302 KBytes [ 7] 3.00-4.00 sec 7.50 MBytes 62.9 Mbits/sec 2 148 KBytes [ 9] 3.00-4.00 sec 13.8 MBytes 115 Mbits/sec 5 242 KBytes [ 11] 3.00-4.00 sec 7.50 MBytes 62.9 Mbits/sec 2 140 KBytes [ 13] 3.00-4.00 sec 11.2 MBytes 94.4 Mbits/sec 0 244 KBytes [SUM] 3.00-4.00 sec 55.0 MBytes 461 Mbits/sec 9 - - - - - - - - - - - - - - - - - - - - - - - - - [ 5] 4.00-5.00 sec 16.2 MBytes 136 Mbits/sec 0 338 KBytes [ 7] 4.00-5.00 sec 7.50 MBytes 62.9 Mbits/sec 2 130 KBytes [ 9] 4.00-5.00 sec 12.5 MBytes 105 Mbits/sec 0 278 KBytes [ 11] 4.00-5.00 sec 7.50 MBytes 62.9 Mbits/sec 0 176 KBytes [ 13] 4.00-5.00 sec 11.2 MBytes 94.4 Mbits/sec 2 206 KBytes [SUM] 4.00-5.00 sec 55.0 MBytes 461 Mbits/sec 4 ^C- - - - - - - - - - - - - - - - - - - - - - - - - [ 5] 5.00-5.48 sec 7.50 MBytes 132 Mbits/sec 0 355 KBytes [ 7] 5.00-5.48 sec 3.75 MBytes 65.9 Mbits/sec 0 146 KBytes [ 9] 5.00-5.48 sec 6.25 MBytes 110 Mbits/sec 1 208 KBytes [ 11] 5.00-5.48 sec 5.00 MBytes 87.8 Mbits/sec 0 194 KBytes [ 13] 5.00-5.48 sec 5.00 MBytes 87.8 Mbits/sec 0 222 KBytes [SUM] 5.00-5.48 sec 27.5 MBytes 483 Mbits/sec 1 - - - - - - - - - - - - - - - - - - - - - - - - - [ ID] Interval Transfer Bitrate Retr [ 5] 0.00-5.48 sec 74.5 MBytes 114 Mbits/sec 233 sender [ 5] 0.00-5.48 sec 0.00 Bytes 0.00 bits/sec receiver [ 7] 0.00-5.48 sec 53.0 MBytes 81.2 Mbits/sec 257 sender [ 7] 0.00-5.48 sec 0.00 Bytes 0.00 bits/sec receiver [ 9] 0.00-5.48 sec 73.9 MBytes 113 Mbits/sec 297 sender [ 9] 0.00-5.48 sec 0.00 Bytes 0.00 bits/sec receiver [ 11] 0.00-5.48 sec 55.8 MBytes 85.4 Mbits/sec 328 sender [ 11] 0.00-5.48 sec 0.00 Bytes 0.00 bits/sec receiver [ 13] 0.00-5.48 sec 62.5 MBytes 95.7 Mbits/sec 181 sender [ 13] 0.00-5.48 sec 0.00 Bytes 0.00 bits/sec receiver [SUM] 0.00-5.48 sec 320 MBytes 489 Mbits/sec 1296 sender [SUM] 0.00-5.48 sec 0.00 Bytes 0.00 bits/sec receiver ```
Owner

I'm not quite sure what you mean by this. My understanding of replication_mode = "3" (which is what my cluster is configured with) was that write operations need to complete on all three nodes before continuing, but perhaps I got that wrong. The only reference to asynchronous writes that I can find in the documentation refers to replication_mode = "2-dangerous".

Since Garage wants to tolerate node failures, it will accept writes even if one node is unavailable. In that case, the data block will be propagated to that node when it comes back online. But crucially, the logic is the same whether the node is available or not: try to write the block to three nodes, and return ok as soon as two writes complete. So even if all three nodes are online, the third write is always asynchronous, although in general it terminates early enough so that not too much data gets buffered in RAM. (if the node is disconnected, Garage knows to just fail the transfer and not keep the data in RAM, so the issue is exacerbated in middle-ground cases: the node is available but with degraded bandwidth compared to the rest)

In any case, I made an initial quick test with the rclone flag --bwlimit set to 10M:10M (limiting up/down bandwidth to 10 MiB/s), but this seems to have made no difference. I stopped the upload at 1,250 MB RAM usage and noticed that, several minutes later, Garage would still sit at that level of memory usage—on all three nodes, not just the one receiving PUT requests.

It's very strange that the RAM usage is high on all of the three nodes, there should be at least one node that has lower RAM usage. It's also strange that it does not decrease progressively over time as data is being transferred (although that could be explained by the networking scheduling algorihtm). The strangest thing is that it does not seem to decrease even after waiting for a long time. So I think that my explanation is not enough for what you are seeing, there has to be something else.

Can you check the network traffic between nodes, during the upload and after interrupting rclone? And also whether there is still network traffic a few minutes later, when you still see high RAM usage? jnettop is a great tool to view the traffic going through active network connections. What would be interesting is if we could detect a scenario like this for example: buffering happens, RAM usage is high, there is some network traffic for some time, and at some point the network traffic stops and all RAM is freed. This would confirm my hypothesis. But if we see some other behavior like network traffic stopping entirely while RAM is still used, it has to be something else.

The ram consumption is probably due to buffering, but given the good iperf benchmarks between your nodes (> 10 MiB/s for both links) this is not enough to explain the issue when limiting the rclone bandwidth to 10MiB/s.

> I'm not quite sure what you mean by this. My understanding of replication_mode = "3" (which is what my cluster is configured with) was that write operations need to complete on all three nodes before continuing, but perhaps I got that wrong. The only reference to asynchronous writes that I can find in the documentation refers to replication_mode = "2-dangerous". Since Garage wants to tolerate node failures, it will accept writes even if one node is unavailable. In that case, the data block will be propagated to that node when it comes back online. But crucially, the logic is the same whether the node is available or not: try to write the block to three nodes, and return ok as soon as two writes complete. So even if all three nodes are online, the third write is always asynchronous, although in general it terminates early enough so that not too much data gets buffered in RAM. (if the node is disconnected, Garage knows to just fail the transfer and not keep the data in RAM, so the issue is exacerbated in middle-ground cases: the node is available but with degraded bandwidth compared to the rest) > In any case, I made an initial quick test with the rclone flag --bwlimit set to 10M:10M (limiting up/down bandwidth to 10 MiB/s), but this seems to have made no difference. I stopped the upload at 1,250 MB RAM usage and noticed that, several minutes later, Garage would still sit at that level of memory usage—on all three nodes, not just the one receiving PUT requests. It's very strange that the RAM usage is high on all of the three nodes, there should be at least one node that has lower RAM usage. It's also strange that it does not decrease progressively over time as data is being transferred (although that could be explained by the networking scheduling algorihtm). The strangest thing is that it does not seem to decrease even after waiting for a long time. So I think that my explanation is not enough for what you are seeing, there has to be something else. Can you check the network traffic between nodes, during the upload and after interrupting rclone? And also whether there is still network traffic a few minutes later, when you still see high RAM usage? `jnettop` is a great tool to view the traffic going through active network connections. What would be interesting is if we could detect a scenario like this for example: buffering happens, RAM usage is high, there is some network traffic for some time, and at some point the network traffic stops and all RAM is freed. This would confirm my hypothesis. But if we see some other behavior like network traffic stopping entirely while RAM is still used, it has to be something else. The ram consumption is probably due to buffering, but given the good iperf benchmarks between your nodes (> 10 MiB/s for both links) this is not enough to explain the issue when limiting the rclone bandwidth to 10MiB/s.
Author

Since Garage wants to tolerate node failures, it will accept writes even if one node is unavailable. In that case, the data block will be propagated to that node when it comes back online. But crucially, the logic is the same whether the node is available or not: try to write the block to three nodes, and return ok as soon as two writes complete. So even if all three nodes are online, the third write is always asynchronous, although in general it terminates early enough so that not too much data gets buffered in RAM. (if the node is disconnected, Garage knows to just fail the transfer and not keep the data in RAM, so the issue is exacerbated in middle-ground cases: the node is available but with degraded bandwidth compared to the rest)

Interesting. Thanks for the explanation!

I set out to run the tests you requested, and you're probably right that there are some network shenanigans going on, since I cannot now reproduce exactly the problem I saw earlier where all nodes would see a RAM spike and continue to sit at a high memory consumption even after the upload was aborted. I am certain I saw this several times before, though.

As of right now, what I'm seeing during the upload is more in line with what you were predicting:

10.10.10.10 (500 Mbit/s link), the node receiving PUT requests, sees increasing RAM usage until OOM.
10.10.10.12 (200 Mbit/s link) climbs to about 300–500 MB RAM but no more.
10.10.10.13 (500 Mbit/s link) sits comfortably at 10–30 MB RAM

Again, the upload command is the following:

rclone copy mp3-dir garage:cld/mp3-dir --progress --fast-list --transfers 8

During the upload, I ran the following jnettop command on the PUT node, limiting the query to traffic on port 3901 over the Wireguard interface that connects the nodes (wg-mesh):

$ sudo jnettop -i wg-mesh -x "port 3901" --display text -t 10 --format '$src$:$srcport$ $dst$:$dstport$ $totalbps$'

Results:

Upload started, PUT node at < 100 MB RAM:

10.10.10.10:34438 10.10.10.13:3901 31952860
10.10.10.10:44422 10.10.10.12:3901 24404680
10.10.10.10:3901 10.10.10.13:37500 4268
10.10.10.10:3901 10.10.10.12:50272 3973

2 minutes in, 4 GB transfered, PUT node @ 1GB RAM:

10.10.10.10:34438 10.10.10.13:3901 33051086
10.10.10.10:44422 10.10.10.12:3901 24278515
10.10.10.10:3901 10.10.10.12:50272 4527
10.10.10.10:3901 10.10.10.13:37500 4173

Upload just aborted, RAM steadily declining on both nodes that saw an increase:

10.10.10.10:44422 10.10.10.12:3901 24378999
10.10.10.10:3901 10.10.10.12:50272 0
10.10.10.10:34438 10.10.10.13:3901 0
10.10.10.10:3901 10.10.10.13:37500 0

RAM back to < 20 MB after a minute or so:

10.10.10.10:44422 10.10.10.12:3901 239
10.10.10.10:34438 10.10.10.13:3901 191
10.10.10.10:3901 10.10.10.13:37500 191
10.10.10.10:3901 10.10.10.12:50272 90
> Since Garage wants to tolerate node failures, it will accept writes even if one node is unavailable. In that case, the data block will be propagated to that node when it comes back online. But crucially, the logic is the same whether the node is available or not: try to write the block to three nodes, and return ok as soon as two writes complete. So even if all three nodes are online, the third write is always asynchronous, although in general it terminates early enough so that not too much data gets buffered in RAM. (if the node is disconnected, Garage knows to just fail the transfer and not keep the data in RAM, so the issue is exacerbated in middle-ground cases: the node is available but with degraded bandwidth compared to the rest) Interesting. Thanks for the explanation! I set out to run the tests you requested, and you're probably right that there are some network shenanigans going on, since I cannot now reproduce exactly the problem I saw earlier where all nodes would see a RAM spike and continue to sit at a high memory consumption even after the upload was aborted. I am certain I saw this several times before, though. As of right now, what I'm seeing during the upload is more in line with what you were predicting: `10.10.10.10` (500 Mbit/s link), the node receiving PUT requests, sees increasing RAM usage until OOM. `10.10.10.12` (200 Mbit/s link) climbs to about 300–500 MB RAM but no more. `10.10.10.13` (500 Mbit/s link) sits comfortably at 10–30 MB RAM Again, the upload command is the following: `rclone copy mp3-dir garage:cld/mp3-dir --progress --fast-list --transfers 8` During the upload, I ran the following `jnettop` command on the PUT node, limiting the query to traffic on port 3901 over the Wireguard interface that connects the nodes (`wg-mesh`): `$ sudo jnettop -i wg-mesh -x "port 3901" --display text -t 10 --format '$src$:$srcport$ $dst$:$dstport$ $totalbps$'` Results: Upload started, PUT node at < 100 MB RAM: ``` 10.10.10.10:34438 10.10.10.13:3901 31952860 10.10.10.10:44422 10.10.10.12:3901 24404680 10.10.10.10:3901 10.10.10.13:37500 4268 10.10.10.10:3901 10.10.10.12:50272 3973 ``` 2 minutes in, 4 GB transfered, PUT node @ 1GB RAM: ``` 10.10.10.10:34438 10.10.10.13:3901 33051086 10.10.10.10:44422 10.10.10.12:3901 24278515 10.10.10.10:3901 10.10.10.12:50272 4527 10.10.10.10:3901 10.10.10.13:37500 4173 ``` Upload just aborted, RAM steadily declining on both nodes that saw an increase: ``` 10.10.10.10:44422 10.10.10.12:3901 24378999 10.10.10.10:3901 10.10.10.12:50272 0 10.10.10.10:34438 10.10.10.13:3901 0 10.10.10.10:3901 10.10.10.13:37500 0 ``` RAM back to < 20 MB after a minute or so: ``` 10.10.10.10:44422 10.10.10.12:3901 239 10.10.10.10:34438 10.10.10.13:3901 191 10.10.10.10:3901 10.10.10.13:37500 191 10.10.10.10:3901 10.10.10.12:50272 90 ```
Owner

Thanks, these results seem pretty consistent with what I was expecting.

Do you have an idea why Garage is not maxing out your network connection? Are your nodes running at 100% CPU all this time?

I think the fix will be on these two points:

  • add a mechanism to limit the number of data blocks that can be bufferred at any given time on the sending side

  • change the network scheduling algorithm to avoid excessive buffering on the receiving side

Thanks, these results seem pretty consistent with what I was expecting. Do you have an idea why Garage is not maxing out your network connection? Are your nodes running at 100% CPU all this time? I think the fix will be on these two points: - add a mechanism to limit the number of data blocks that can be bufferred at any given time on the sending side - change the network scheduling algorithm to avoid excessive buffering on the receiving side
Owner

Oh, actually I read the units wrong, I thought it was bits and not bytes. If it is bytes then it looks like its maxing out your 200Mbps link which is nice.

Oh, actually I read the units wrong, I thought it was bits and not bytes. If it is bytes then it looks like its maxing out your 200Mbps link which is nice.
Author

Do you have an idea why Garage is not maxing out your network connection? Are your nodes running at 100% CPU all this time?

The nodes are running a production Nomad cluster, but the average CPU usage on all of them is < 5%, so that can't be an issue. What makes you say Garage is not maxing out the network connections, though? Unless I'm misreading the results, jnettop suggests ~30 MB/s (about the same transfer speed reported by rclone), and this does not seem that far off under the circumstances.

EDIT: Nevermind, I typed this up before I saw your most recent comment.

> Do you have an idea why Garage is not maxing out your network connection? Are your nodes running at 100% CPU all this time? ~~The nodes are running a production Nomad cluster, but the average CPU usage on all of them is < 5%, so that can't be an issue. What makes you say Garage is not maxing out the network connections, though? Unless I'm misreading the results, `jnettop` suggests ~30 MB/s (about the same transfer speed reported by `rclone`), and this does not seem that far off under the circumstances.~~ EDIT: Nevermind, I typed this up before I saw your most recent comment.
Owner

@Cycneuramus Could you check if PR #792 fixes the issue? I can trigger a release build / docker image build on our CI if that's more practical for you.

@Cycneuramus Could you check if PR #792 fixes the issue? I can trigger a release build / docker image build on our CI if that's more practical for you.
Author

I can trigger a release build / docker image build on our CI if that's more practical for you.

Yes, that'd be much appreciated since I'd like to test it out in Nomad with the Docker driver.

> I can trigger a release build / docker image build on our CI if that's more practical for you. Yes, that'd be much appreciated since I'd like to test it out in Nomad with the Docker driver.
Author

Thanks. I'll give it a try tomorrow and report back.

Thanks. I'll give it a try tomorrow and report back.
Owner

The Docker image is dxflrs/garage:85f580cbde4913fe8382316ff3c27b8443c61dd7

The Docker image is `dxflrs/garage:85f580cbde4913fe8382316ff3c27b8443c61dd7`
Author

I rebuilt my cluster from the ground up (using 
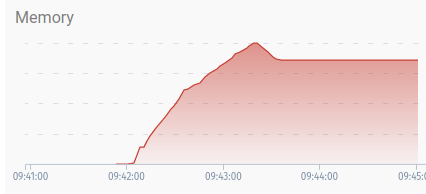
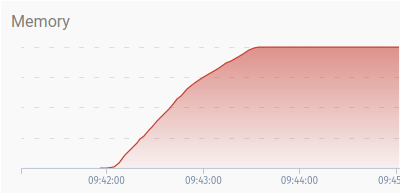
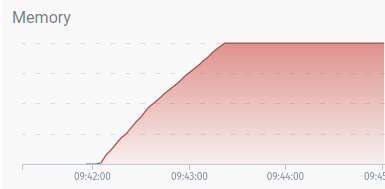
lmdb) on the new Docker image. No dice, I'm afraid. I'm now back to the odd behavior I could observe on the sqlite backend as well, where all nodes will gobble up memory and not release it even after the transfer is stopped.

Here's what the memory curves look like during my upload test, the same one as before. The upload start/stop is probably apparent, and the peaks represent ~2 GB RAM:

PUT node, 500 Mbit/s:
apex.png

The 200 Mbit/s node:
arca.png

The 500 Mbit/s node:
arm.png

Some stats from sudo jnettop -i wg-mesh -x "port 3901" --display text -t 10 --format '$src$:$srcport$ $dst$:$dstport$ $totalbps$':

Upload recently started, all nodes @ 1 GB RAM:

10.10.10.10:41690 10.10.10.12:3901 24227211
10.10.10.10:38858 10.10.10.13:3901 24016161
10.10.10.10:3901 10.10.10.13:44804 2837
10.10.10.10:3901 10.10.10.12:35952 2451

Upload stopped, all nodes @ 1,5–2 GB ram:

10.10.10.10:41690 10.10.10.12:3901 24327593
10.10.10.10:3901 10.10.10.12:35952 0
10.10.10.10:38858 10.10.10.13:3901 0
10.10.10.10:3901 10.10.10.13:44804 0

Minutes after stopped upload, all nodes still @ 1.5–2 GB RAM:

10.10.10.10:3901 10.10.10.12:35952 138
10.10.10.10:41690 10.10.10.12:3901 0
10.10.10.10:38858 10.10.10.13:3901 0
10.10.10.10:3901 10.10.10.13:44804 0

Even after 20 minutes, the memory usage have gone down by maybe a couple of hundred MBs but otherwise still holds around 1.5–2 GB on all nodes.

The only anomalies I could see in the log (though I'm not sure even this fits) were these sync messages spanning over ten seconds or so, on all nodes, a few minutes after the upload was stopped, and then again ~10 minutes later:

2024-03-28T08:45:26.992665Z  INFO garage_block::resync: Resync block 095c33a732a39e7e: offloading and deleting
2024-03-28T08:45:27.021772Z  INFO garage_block::resync: Deleting unneeded block 095c33a732a39e7e, offload finished (0 / 2)
2024-03-28T08:45:27.025961Z  INFO garage_block::resync: Resync block 104b22ee20bf34a6: offloading and deleting
2024-03-28T08:45:27.054255Z  INFO garage_block::resync: Deleting unneeded block 104b22ee20bf34a6, offload finished (0 / 2)
2024-03-28T08:45:27.060749Z  INFO garage_block::resync: Resync block 22638415c79f4ca1: offloading and deleting
2024-03-28T08:45:27.088629Z  INFO garage_block::resync: Deleting unneeded block 22638415c79f4ca1, offload finished (0 / 2)
[...]

Output of garage stats -a after the upload test described above:

======================
Stats for node 10efc5e3c2deda46:

Garage version: 85f580cbde4913fe8382316ff3c27b8443c61dd7 [features: k2v, sled, lmdb, sqlite, consul-discovery, kubernetes-discovery, metrics, telemetry-otlp, bundled-libs]
Rust compiler version: 1.73.0

Database engine: LMDB (using Heed crate)

Table stats:
  Table      Items  MklItems  MklTodo  GcTodo
  bucket_v2  1      1         0        0
  key        1      1         0        0
  object     811    1030      0        0
  version    811    1023      0        23
  block_ref  6389   6914      0        211

Block manager stats:
  number of RC entries (~= number of blocks): 6224
  resync queue length: 0
  blocks with resync errors: 0

If values are missing above (marked as NC), consider adding the --detailed flag (this will be slow).


======================
Stats for node 563250eb594669f1:

Garage version: 85f580cbde4913fe8382316ff3c27b8443c61dd7 [features: k2v, sled, lmdb, sqlite, consul-discovery, kubernetes-discovery, metrics, telemetry-otlp, bundled-libs]
Rust compiler version: 1.73.0

Database engine: LMDB (using Heed crate)

Table stats:
  Table      Items  MklItems  MklTodo  GcTodo
  bucket_v2  1      1         0        0
  key        1      1         0        0
  object     811    1030      0        0
  version    811    1023      0        0
  block_ref  6389   6914      0        0

Block manager stats:
  number of RC entries (~= number of blocks): 6225
  resync queue length: 0
  blocks with resync errors: 0

If values are missing above (marked as NC), consider adding the --detailed flag (this will be slow).


======================
Stats for node db6dc90a79076a3e:

Garage version: 85f580cbde4913fe8382316ff3c27b8443c61dd7 [features: k2v, sled, lmdb, sqlite, consul-discovery, kubernetes-discovery, metrics, telemetry-otlp, bundled-libs]
Rust compiler version: 1.73.0

Database engine: LMDB (using Heed crate)

Table stats:
  Table      Items  MklItems  MklTodo  GcTodo
  bucket_v2  1      1         0        0
  key        1      1         0        0
  object     811    1030      0        0
  version    811    1023      0        0
  block_ref  6389   6914      0        0

Block manager stats:
  number of RC entries (~= number of blocks): 6221
  resync queue length: 0
  blocks with resync errors: 0

If values are missing above (marked as NC), consider adding the --detailed flag (this will be slow).


======================
Cluster statistics:

Storage nodes:
  ID                Hostname      Zone  Capacity  Part.  DataAvail                  MetaAvail
  db6dc90a79076a3e  8b88777395ed  ocl   150.0 GB  256    153.9 GB/161.0 GB (95.6%)  153.9 GB/161.0 GB (95.6%)
  10efc5e3c2deda46  26dab13e7cff  eso   250.0 GB  256    286.9 GB/489.6 GB (58.6%)  286.9 GB/489.6 GB (58.6%)
  563250eb594669f1  738f4504327c  exo   450.0 GB  256    503.2 GB/630.9 GB (79.8%)  503.2 GB/630.9 GB (79.8%)

Estimated available storage space cluster-wide (might be lower in practice):
  data: 153.9 GB
  metadata: 153.9 GB
I rebuilt my cluster from the ground up (using `lmdb`) on the new Docker image. No dice, I'm afraid. I'm now back to the odd behavior I could observe on the `sqlite` backend as well, where all nodes will gobble up memory and not release it even after the transfer is stopped. Here's what the memory curves look like during my upload test, the same one as before. The upload start/stop is probably apparent, and the peaks represent ~2 GB RAM: PUT node, 500 Mbit/s: ![apex.png](/attachments/a7c02073-e412-4c7c-89b9-661c25889cd0) The 200 Mbit/s node: ![arca.png](/attachments/46d66458-d87f-49b3-901c-9a4de8d8b02d) The 500 Mbit/s node: ![arm.png](/attachments/f6632abf-9287-47c6-86c1-12b3b0fe5612) Some stats from `sudo jnettop -i wg-mesh -x "port 3901" --display text -t 10 --format '$src$:$srcport$ $dst$:$dstport$ $totalbps$'`: Upload recently started, all nodes @ 1 GB RAM: ``` 10.10.10.10:41690 10.10.10.12:3901 24227211 10.10.10.10:38858 10.10.10.13:3901 24016161 10.10.10.10:3901 10.10.10.13:44804 2837 10.10.10.10:3901 10.10.10.12:35952 2451 ``` Upload stopped, all nodes @ 1,5–2 GB ram: ``` 10.10.10.10:41690 10.10.10.12:3901 24327593 10.10.10.10:3901 10.10.10.12:35952 0 10.10.10.10:38858 10.10.10.13:3901 0 10.10.10.10:3901 10.10.10.13:44804 0 ``` Minutes after stopped upload, all nodes still @ 1.5–2 GB RAM: ``` 10.10.10.10:3901 10.10.10.12:35952 138 10.10.10.10:41690 10.10.10.12:3901 0 10.10.10.10:38858 10.10.10.13:3901 0 10.10.10.10:3901 10.10.10.13:44804 0 ``` Even after 20 minutes, the memory usage have gone down by maybe a couple of hundred MBs but otherwise still holds around 1.5–2 GB on all nodes. The only anomalies I could see in the log (though I'm not sure even this fits) were these sync messages spanning over ten seconds or so, on all nodes, a few minutes after the upload was stopped, and then again ~10 minutes later: ``` 2024-03-28T08:45:26.992665Z INFO garage_block::resync: Resync block 095c33a732a39e7e: offloading and deleting 2024-03-28T08:45:27.021772Z INFO garage_block::resync: Deleting unneeded block 095c33a732a39e7e, offload finished (0 / 2) 2024-03-28T08:45:27.025961Z INFO garage_block::resync: Resync block 104b22ee20bf34a6: offloading and deleting 2024-03-28T08:45:27.054255Z INFO garage_block::resync: Deleting unneeded block 104b22ee20bf34a6, offload finished (0 / 2) 2024-03-28T08:45:27.060749Z INFO garage_block::resync: Resync block 22638415c79f4ca1: offloading and deleting 2024-03-28T08:45:27.088629Z INFO garage_block::resync: Deleting unneeded block 22638415c79f4ca1, offload finished (0 / 2) [...] ``` Output of `garage stats -a` after the upload test described above: ``` ====================== Stats for node 10efc5e3c2deda46: Garage version: 85f580cbde4913fe8382316ff3c27b8443c61dd7 [features: k2v, sled, lmdb, sqlite, consul-discovery, kubernetes-discovery, metrics, telemetry-otlp, bundled-libs] Rust compiler version: 1.73.0 Database engine: LMDB (using Heed crate) Table stats: Table Items MklItems MklTodo GcTodo bucket_v2 1 1 0 0 key 1 1 0 0 object 811 1030 0 0 version 811 1023 0 23 block_ref 6389 6914 0 211 Block manager stats: number of RC entries (~= number of blocks): 6224 resync queue length: 0 blocks with resync errors: 0 If values are missing above (marked as NC), consider adding the --detailed flag (this will be slow). ====================== Stats for node 563250eb594669f1: Garage version: 85f580cbde4913fe8382316ff3c27b8443c61dd7 [features: k2v, sled, lmdb, sqlite, consul-discovery, kubernetes-discovery, metrics, telemetry-otlp, bundled-libs] Rust compiler version: 1.73.0 Database engine: LMDB (using Heed crate) Table stats: Table Items MklItems MklTodo GcTodo bucket_v2 1 1 0 0 key 1 1 0 0 object 811 1030 0 0 version 811 1023 0 0 block_ref 6389 6914 0 0 Block manager stats: number of RC entries (~= number of blocks): 6225 resync queue length: 0 blocks with resync errors: 0 If values are missing above (marked as NC), consider adding the --detailed flag (this will be slow). ====================== Stats for node db6dc90a79076a3e: Garage version: 85f580cbde4913fe8382316ff3c27b8443c61dd7 [features: k2v, sled, lmdb, sqlite, consul-discovery, kubernetes-discovery, metrics, telemetry-otlp, bundled-libs] Rust compiler version: 1.73.0 Database engine: LMDB (using Heed crate) Table stats: Table Items MklItems MklTodo GcTodo bucket_v2 1 1 0 0 key 1 1 0 0 object 811 1030 0 0 version 811 1023 0 0 block_ref 6389 6914 0 0 Block manager stats: number of RC entries (~= number of blocks): 6221 resync queue length: 0 blocks with resync errors: 0 If values are missing above (marked as NC), consider adding the --detailed flag (this will be slow). ====================== Cluster statistics: Storage nodes: ID Hostname Zone Capacity Part. DataAvail MetaAvail db6dc90a79076a3e 8b88777395ed ocl 150.0 GB 256 153.9 GB/161.0 GB (95.6%) 153.9 GB/161.0 GB (95.6%) 10efc5e3c2deda46 26dab13e7cff eso 250.0 GB 256 286.9 GB/489.6 GB (58.6%) 286.9 GB/489.6 GB (58.6%) 563250eb594669f1 738f4504327c exo 450.0 GB 256 503.2 GB/630.9 GB (79.8%) 503.2 GB/630.9 GB (79.8%) Estimated available storage space cluster-wide (might be lower in practice): data: 153.9 GB metadata: 153.9 GB ```
6.5 KiB
5.9 KiB
5.7 KiB
Author

I just observed, 30–40 minutes after the upload was stopped, the 200 Mbit/s node jumping back down to < 20 MB RAM over the course of 1 minute. The other nodes are still at 1.5–2 GB RAM though. The logs show nothing of note.

I just observed, 30–40 minutes after the upload was stopped, the 200 Mbit/s node jumping back down to < 20 MB RAM over the course of 1 minute. The other nodes are still at 1.5–2 GB RAM though. The logs show nothing of note.
Owner

Thank you for your patience in trying to work this out.

Can you confirm that this memory is not just the memory map of LMDB's data file, but actual allocations made by Garage like buffer and stuff? The difference between the two is that LMDB's data file can easily be removed from RAM by the kernel, but it will only do so when the memory needs to be reclaimed for something else, whereas Garage's allocations cannot be reclaimed. Memory for the LMDB data file is counted by Nomad because it's hard to distinguish between the two, but it does not cause an OOM kill if it grows excessively.

Here are some tests you can do:

  1. Can you try cat /proc/<pid>/status like here? LMDB's memory appears under RssFile, whereas Garage's own allocations appear under RssAnon (if you are using the same Linux platform).

  2. Do your containers still get OOM killed if you let the transfer run longer?

  3. Do you also have this with the sqlite backend?

Thank you for your patience in trying to work this out. Can you confirm that this memory is not just the memory map of LMDB's data file, but actual allocations made by Garage like buffer and stuff? The difference between the two is that LMDB's data file can easily be removed from RAM by the kernel, but it will only do so when the memory needs to be reclaimed for something else, whereas Garage's allocations cannot be reclaimed. Memory for the LMDB data file is counted by Nomad because it's hard to distinguish between the two, but it does not cause an OOM kill if it grows excessively. Here are some tests you can do: 1. Can you try `cat /proc/<pid>/status` like [here](https://git.deuxfleurs.fr/Deuxfleurs/garage/issues/681#issuecomment-7733)? LMDB's memory appears under RssFile, whereas Garage's own allocations appear under RssAnon (if you are using the same Linux platform). 2. Do your containers still get OOM killed if you let the transfer run longer? 3. Do you also have this with the sqlite backend?
Author

Ah, sorry for introducing this ambiguity in my test. It appears your instinct was correct:

RssAnon: 311652 kB
RssFile: 28288 kB

Actual RAM usage seems to sit between 300–400 MB during the course of the upload, with no OOM killing during the 10–15 minutes I let the upload run (before your fix, this would otherwise have happened way before that).

By the way, since the 200 Mbit/s node only has 6 GB RAM (whereas the other two have 32 GB / 24 GB), the lmdb memory behaviour you describe seems consistent with what I observed before about the 200 Mbit/s node suddenly going from ~2 GB RAM to 20 MB while the other two did not.

In any case, I rebuilt the cluster on sqlite again, with pretty much the same results—though, curiously, the RAM usage reported by Nomad is still through the roof as in the case of lmdb, but since I don't know the inner workings of the DB engines, perhaps this is to be expected. In actual practice, though:

RssAnon:	 336184 kB
RssFile:	  15376 kB

So it seems your fix is working. I'll go ahead and actually try to use this thing now and see how it goes.

Nicely done, and thanks for your help!

Ah, sorry for introducing this ambiguity in my test. It appears your instinct was correct: ``` RssAnon: 311652 kB RssFile: 28288 kB ``` Actual RAM usage seems to sit between 300–400 MB during the course of the upload, with no OOM killing during the 10–15 minutes I let the upload run (before your fix, this would otherwise have happened way before that). By the way, since the 200 Mbit/s node only has 6 GB RAM (whereas the other two have 32 GB / 24 GB), the `lmdb` memory behaviour you describe seems consistent with what I observed before about the 200 Mbit/s node suddenly going from ~2 GB RAM to 20 MB while the other two did not. In any case, I rebuilt the cluster on `sqlite` again, with pretty much the same results—though, curiously, the RAM usage reported by Nomad is still through the roof as in the case of `lmdb`, but since I don't know the inner workings of the DB engines, perhaps this is to be expected. In actual practice, though: ``` RssAnon: 336184 kB RssFile: 15376 kB ``` So it seems your fix is working. I'll go ahead and actually try to use this thing now and see how it goes. Nicely done, and thanks for your help!
Owner

Thanks, I'll let you close the issue then if you feel we've resolved the discussion.

Thanks, I'll let you close the issue then if you feel we've resolved the discussion.
Sign in to join this conversation.
No Milestone
No Assignees
2 Participants
Notifications
Due Date
The due date is invalid or out of range. Please use the format 'yyyy-mm-dd'.

No due date set.

Dependencies

No dependencies set.

Reference: Deuxfleurs/garage#788
No description provided.