14 KiB
Liveness issues
We know that some people reported having timeouts when putting some load on their Garage cluster. On our production cluster that runs without pressure, we don't really observe this behaviour.
But when I wanted to start a benchmark created by Minio developers, I hit the same limit. So I wanted to reproduce this behavior in a more controlled environment.
Reproducing the error in mknet
I used mknet to emulate a simple network with close to zero latency but with a very small bandwidth: 1Mbit/s. The idea is that the network will be the bottleneck, but not the CPU, the memory or the disk, even on my low powered laptop. The following configuration describes the simulated network configuration I used:
links:
  - &slow
    bandwidth: 1M
    latency: 500us
  - &1000
    bandwidth: 1000M
    latency: 100us

servers:
  - name: node1
    <<: *slow
  - name: node2
    <<: *slow
  - name: node3
    <<: *slow

global:
  subnet:
    base: 'fc00:9a7a:9e::'
    local: 64
    zone: 16
  latency-offset: 3ms
  upstream:
    ip: fc00:9a7a:9e:ffff:ffff:ffff:ffff:ffff
    conn: *1000
After a while, we quickly observe that the cluster is not reacting very well:
[nix-shell:/home/quentin/Documents/dev/deuxfleurs/mknet]# warp get --host=[fc00:9a7a:9e::1]:3900 --obj.size 100MiB --obj.randsize --duration=10m --concurrent 8 --objects 200 --access-key=GKc1e16da48142bdb95d98a4e4 --secret-key=c4ef5d5f7ee24ccae12a98912bf5b1fda28120a7e3a8f90cb3710c8683478b31
Creating Bucket "warp-benchmark-bucket"...Element { tag_name: {http://s3.amazonaws.com/doc/2006-03-01/}LocationConstraint, attributes: [], namespaces: [Namespace { name: None, uri: "http://s3.amazonaws.com/doc/2006-03-01/" }] }
warp: <ERROR> upload error: Internal error: Could not reach quorum of 2. 1 of 3 request succeeded, others returned errors: ["Timeout", "Timeout"]
warp: <ERROR> upload error: Internal error: Could not reach quorum of 2. 1 of 3 request succeeded, others returned errors: ["Netapp error: Not connected: 3cb7ed98f7c66a55", "Netapp error: Not connected: 92c7fb74ed89f289"]
warp: <ERROR> upload error: Put "http://[fc00:9a7a:9e::1]:3900/warp-benchmark-bucket/xVdzjy23/1.KximayVLlhLwfE5f.rnd": dial tcp [fc00:9a7a:9e::1]:3900: i/o timeout
warp: <ERROR> upload error: Put "http://[fc00:9a7a:9e::1]:3900/warp-benchmark-bucket/N4zQvKhs/1.XkkO6DJ%28hVpGIrMj.rnd": dial tcp [fc00:9a7a:9e::1]:3900: i/o timeout
warp: <ERROR> upload error: Internal error: Could not reach quorum of 2. 1 of 3 request succeeded, others returned errors: ["Timeout", "Timeout"]
warp: <ERROR> upload error: Internal error: Could not reach quorum of 2. 1 of 3 request succeeded, others returned errors: ["Netapp error: Not connected: 3cb7ed98f7c66a55", "Netapp error: Not connected: 92c7fb74ed89f289"]
warp: <ERROR> upload error: Put "http://[fc00:9a7a:9e::1]:3900/warp-benchmark-bucket/GQrsevhN/1.7hglGIP%28mXTJMgFE.rnd": read tcp [fc00:9a7a:9e:ffff:ffff:ffff:ffff:ffff]:57008->[fc00:9a7a:9e::1]:3900: read: connection reset by peer

warp: <ERROR> Error preparing server: upload error: Internal error: Could not reach quorum of 2. 1 of 3 request succeeded, others returned errors: ["Timeout", "Timeout"].
We observe many different types of error that I categorize as follow:
- [RPC] Timeout quorum errors, they are probably generated by a ping between nodes
- [RPC] Not connected error, after a timeout, a reconnection is not triggered directly
- [S3 Gateway] The gateway took to much time to answer and a timeout was triggered in the client
- [S3 Gateway] The S3 gateway closes the TCP connection before answering
As a first conclusion, we started to clearly reduce the scope of the problem by identifying that this undesirable behavior is triggered by a network bottleneck.
Looking at Garage logs, we see that:
- node1, which is our S3 gateway, has many quorum errors / netapp not connected errors, which are the same than the ones reported earlier
- node2 and node3 which are only used as storage nodes, have no error/warn in their logs
It starts to really look like a congestion control/control flow error/scheduler issue: our S3 gateway seems to receive more data than it can send over the network, which in turn trigger timeouts, that trigger disconnect, and breaks everything.
Write a custom client exhibiting the issue
We know how to trigger the issue with warp, Minio's benchmark tool but we don't yet understand well what kind of load it puts on the cluster except that it sends concurrently Multipart and PutObject requests concurrently. So, before investigating the issue more in depth, we want to know:
- If a single large PUT request can trigger this issue or not?
- How many parallel requests are needed to trigger this issue?
- Does Multipart transfer are more impacted by this issue?
To get answer to our questions, we will write a specific benchmark. Named s3concurrent, it is available here: https://git.deuxfleurs.fr/quentin/s3concurrent The benchmark starts by sending 1 file, then 2 files concurrently, then 3, then 4, up to 16 (this is hardcoded for now).
When ran on our mknet cluster, we start triggering issues as soon as we send 2 files at once:
$ ./s3concurrent
2022/08/11 20:35:28 created bucket 3ffd6798-bdab-4218-b6d0-973a07e46ea9
2022/08/11 20:35:28 start concurrent loop with 1 coroutines
2022/08/11 20:35:55 done, 1 coroutines returned
2022/08/11 20:35:55 start concurrent loop with 2 coroutines
2022/08/11 20:36:34 1/2 failed with Internal error: Could not reach quorum of 2. 1 of 3 request succeeded, others returned errors: ["Timeout", "Timeout"]
2022/08/11 20:36:37 done, 2 coroutines returned
2022/08/11 20:36:37 start concurrent loop with 3 coroutines
2022/08/11 20:37:13 1/3 failed with Internal error: Could not reach quorum of 2. 1 of 3 request succeeded, others returned errors: ["Netapp error: Not connected: 92c7fb74ed89f289", "Netapp error: Not connected: 3cb7ed98f7c66a55"]
2022/08/11 20:37:51 2/3 failed with Internal error: Could not reach quorum of 2. 1 of 3 request succeeded, others returned errors: ["Netapp error: Not connected: 92c7fb74ed89f289", "Netapp error: Not connected: 3cb7ed98f7c66a55"]
2022/08/11 20:37:51 3/3 failed with Internal error: Could not reach quorum of 2. 1 of 3 request succeeded, others returned errors: ["Netapp error: Not connected: 92c7fb74ed89f289", "Netapp error: Not connected: 3cb7ed98f7c66a55"]
2022/08/11 20:37:51 done, 3 coroutines returned
2022/08/11 20:37:51 start concurrent loop with 4 coroutines
We observe that Garage starts its timeout as soon as 2 coroutines are executed in parallel.
Internally, Garage uses a library of our own named netapp. This library has an integrated scheduler that knows how to:
- handle priority of RPC packets
- multiplex packets of the same priority so that progress is made by everyone
So in theory, this scheduler should be able to handle all our packets seamlessly. To better understand its behaviour, we observe the behaviour of Garage with a smaller block size, to see if it's a multiplexing problem. We select 128 KiB blocks instead of 1MiB ones (10 times smaller).
This time, we can handle 2 coroutines at once but not 3:
2022/08/12 10:50:08 created bucket a565074b-0609-4f5f-8d46-389f86565197
2022/08/12 10:50:08 start concurrent loop with 1 coroutines
2022/08/12 10:50:32 done, 1 coroutines returned
2022/08/12 10:50:32 start concurrent loop with 2 coroutines
2022/08/12 10:51:18 done, 2 coroutines returned
2022/08/12 10:51:18 start concurrent loop with 3 coroutines
2022/08/12 10:51:35 1/3 failed with Internal error: Could not reach quorum of 2. 1 of 3 request succeeded, others returned errors: ["Timeout", "Timeout"]
2022/08/12 10:51:45 2/3 failed with Internal error: Could not reach quorum of 2. 1 of 3 request succeeded, others returned errors: ["Netapp error: Not connected: 0b36b6d0de0a6393", "Netapp error: Not connected: b61e6a192c9462c9"]
2022/08/12 10:51:45 3/3 failed with Internal error: Could not reach quorum of 2. 1 of 3 request succeeded, others returned errors: ["Timeout", "Timeout"]
2022/08/12 10:51:45 done, 3 coroutines returned
2022/08/12 10:51:45 start concurrent loop with 4 coroutines
2022/08/12 10:52:09 1/4 failed with Internal error: Could not reach quorum of 2. 1 of 3 request succeeded, others returned errors: ["Timeout", "Timeout"]
2022/08/12 10:52:13 2/4 failed with Internal error: Could not reach quorum of 2. 1 of 3 request succeeded, others returned errors: ["Netapp error: Not connected: 0b36b6d0de0a6393", "Netapp error: Not connected: b61e6a192c9462c9"]
2022/08/12 10:52:13 3/4 failed with Internal error: Could not reach quorum of 2. 1 of 3 request succeeded, others returned errors: ["Netapp error: Not connected: 0b36b6d0de0a6393", "Netapp error: Not connected: b61e6a192c9462c9"]
2022/08/12 10:52:15 4/4 failed with Internal error: Could not reach quorum of 2. 1 of 3 request succeeded, others returned errors: ["Timeout", "Timeout"]
2022/08/12 10:52:15 done, 4 coroutines returned
Despite the fact we divided by 10 our block size, we did not improve by 10 our parallelism. As a conclusion, we need to question our design.
Making an hypothesis on netapp inner working
First, we took a look at netapp failure detectors. It seems that, despite a closed TCP socket, it has no way to detect failures. So we have a second layer in Garage to detect failures based on timeouts on RPC commands. In our analysis we identified 2 critical RPC commands:
- Ping, that have high priority, and a timeout of 2 seconds
- BlockRW, that have a normal priority, and a timeout of 30 seconds. It appears that the timeout is triggered by the second RPC command. For a reason I don't understand yet, it appears that any timeout will trigger a disconnect/reconnect of the node (with a delay).
So, here is my current mental model of our issue when we send multiple PutObject requests:
- Ping RPC commands are always handled in less than 2sec due to their high priority and their low number
- BlockRW commands are accumulating in the queue without any limit. They all have the same priority, so progress is slowly made on each of them at the same pace. Because they are so many, none of them complete in less than 30 seconds, thus triggering many timeouts in Garage.
To check this hypothesis, I will start by logging netapp queues and their content.
It appears that the problem is more complicated than it seemed first, as we have 2 ping logic, one at the netapp layer and one at the garage layer. And in both ways. And it seems that netapp pings are failing from the storage node to the gateway node.
 WARN  netapp::peering::fullmesh    > Error pinging 90af93030366c0da: Ping timeout
 DEBUG netapp::peering::fullmesh    > Ping from 591ac2bffb05a3ec
 WARN  netapp::peering::fullmesh    > Error pinging 90af93030366c0da: Ping timeout
 WARN  netapp::peering::fullmesh    > Too many failed pings from 90af93030366c0da, closing connection.
 DEBUG netapp::netapp               > Closing connection to 90af93030366c0da ([fc00:9a7a:9e::1]:3901)
Currently Garage does not pipeline writes, so it waits that a chunk has been written before writing the next one. So in the end, we have not so many entries in the queue:
- the first chunk of upload 1
- the first chunk of upload 2
- the first chunk of upload 3, and so on, and so forth
But we can see that problems can still occure with numerous uploads! And if we start pipeling sending, it will make the problem even worse!
It seems that we could improve the situation by:
- Deleting Garage pings as netapp is handling them for us (even if it seems that they are used to measure an average ping - not sure of this point)
- Deleting timeouts on RPC blocks as failure detection is handled by netapp
And to future proof our software:
- Putting a bound to the netapp queue to avoid multiplexing too many requests. It will be usefull especially when/if we start pipelining requests.
- Passing streams to netapp
But before implementing these solutions, we must understand why netapp pings are failing, this is even more surprising as they have a 5 second timeout instead of a 2sec one on Garage... We should really reduce the number of timeouts we are handling...
Understanding why netapp ping timeout despite priorities
todo
Overview of available tools to observe Garage internals
Even if I have some theory on what is going wrong, I want to collect as many information as possible before making hypothesis, adding specific debug hooks, and so on. Hopefully, we have at least 3 different tools in Garage to gather information about its internals:
- Prometheus telemetry
- Opentelemetry traces
- Tokio traces (not sure)
Prometheus
Nothing very interesting is returned by Prometheus telemetry, except we returned 503 and 500 errors:
# HELP api_s3_error_counter Number of API calls to the various S3 API endpoints that resulted in errors
# TYPE api_s3_error_counter counter
api_s3_error_counter{api_endpoint="PutObject",status_code="500"} 3
api_s3_error_counter{api_endpoint="PutObject",status_code="503"} 2
# HELP api_s3_request_counter Number of API calls to the various S3 API endpoints
# TYPE api_s3_request_counter counter
api_s3_request_counter{api_endpoint="CreateBucket"} 1
api_s3_request_counter{api_endpoint="PutObject"} 6
# HELP api_s3_request_duration Duration of API calls to the various S3 API endpoints
# TYPE api_s3_request_duration histogram
api_s3_request_duration_bucket{api_endpoint="CreateBucket",le="0.5"} 1
api_s3_request_duration_bucket{api_endpoint="CreateBucket",le="0.9"} 1
api_s3_request_duration_bucket{api_endpoint="CreateBucket",le="0.99"} 1
api_s3_request_duration_bucket{api_endpoint="CreateBucket",le="+Inf"} 1
api_s3_request_duration_sum{api_endpoint="CreateBucket"} 0.109302301
api_s3_request_duration_count{api_endpoint="CreateBucket"} 1
api_s3_request_duration_bucket{api_endpoint="PutObject",le="0.5"} 0
api_s3_request_duration_bucket{api_endpoint="PutObject",le="0.9"} 0
api_s3_request_duration_bucket{api_endpoint="PutObject",le="0.99"} 0
api_s3_request_duration_bucket{api_endpoint="PutObject",le="+Inf"} 6
api_s3_request_duration_sum{api_endpoint="PutObject"} 147.68400154399998
api_s3_request_duration_count{api_endpoint="PutObject"} 6
Traces with Jaeger and OLTP
Based on Jaeger doc, I run:
docker run --name jaeger \
  -e COLLECTOR_ZIPKIN_HOST_PORT=:9411 \
  -e COLLECTOR_OTLP_ENABLED=true \
  -p 6831:6831/udp \
  -p 6832:6832/udp \
  -p 5778:5778 \
  -p 16686:16686 \
  -p 4317:4317 \
  -p 4318:4318 \
  -p 14250:14250 \
  -p 14268:14268 \
  -p 14269:14269 \
  -p 9411:9411 \
  jaegertracing/all-in-one:1.37
And then I observe:
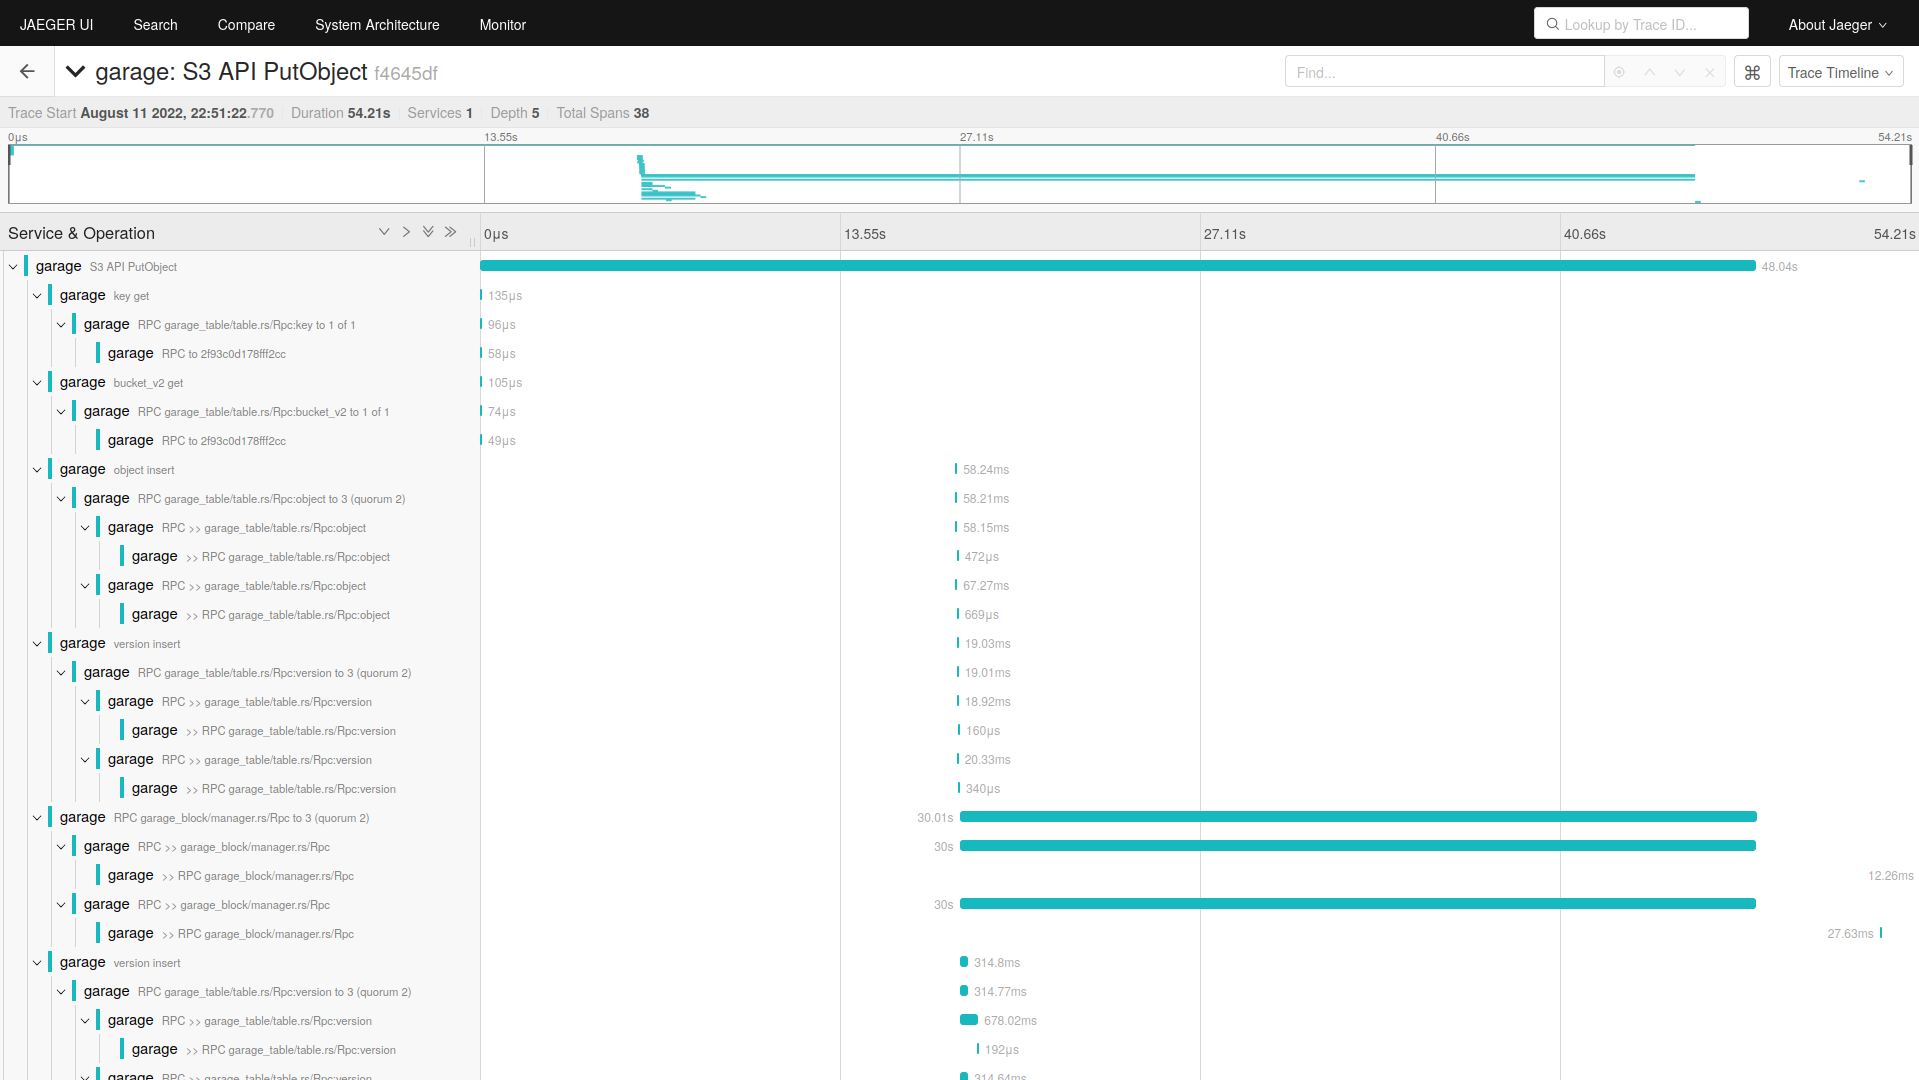
We see many traces with exactly a 30s request. I suspect that we are hitting a timeout here but I am not sure.